
Sivaramakrishnan
Author
Published on : Mar 29, 2024
Category : BizTalk Server
BizTalk360 is a centralized monitoring tool for the BizTalk Server. BizTalk360 not only restricts monitoring with the BizTalk Server alone but also supports the other components to support the smooth functioning of BizTalk. These features helped the customers to operate at ease. A couple of our customer’s use cases came with an interesting request, we found that it is genuine and helps other customers, hence we thought of sharing with all.
In this blog, we have covered how we have provided a solution for the custom use case and helped the customers to attain the use case.
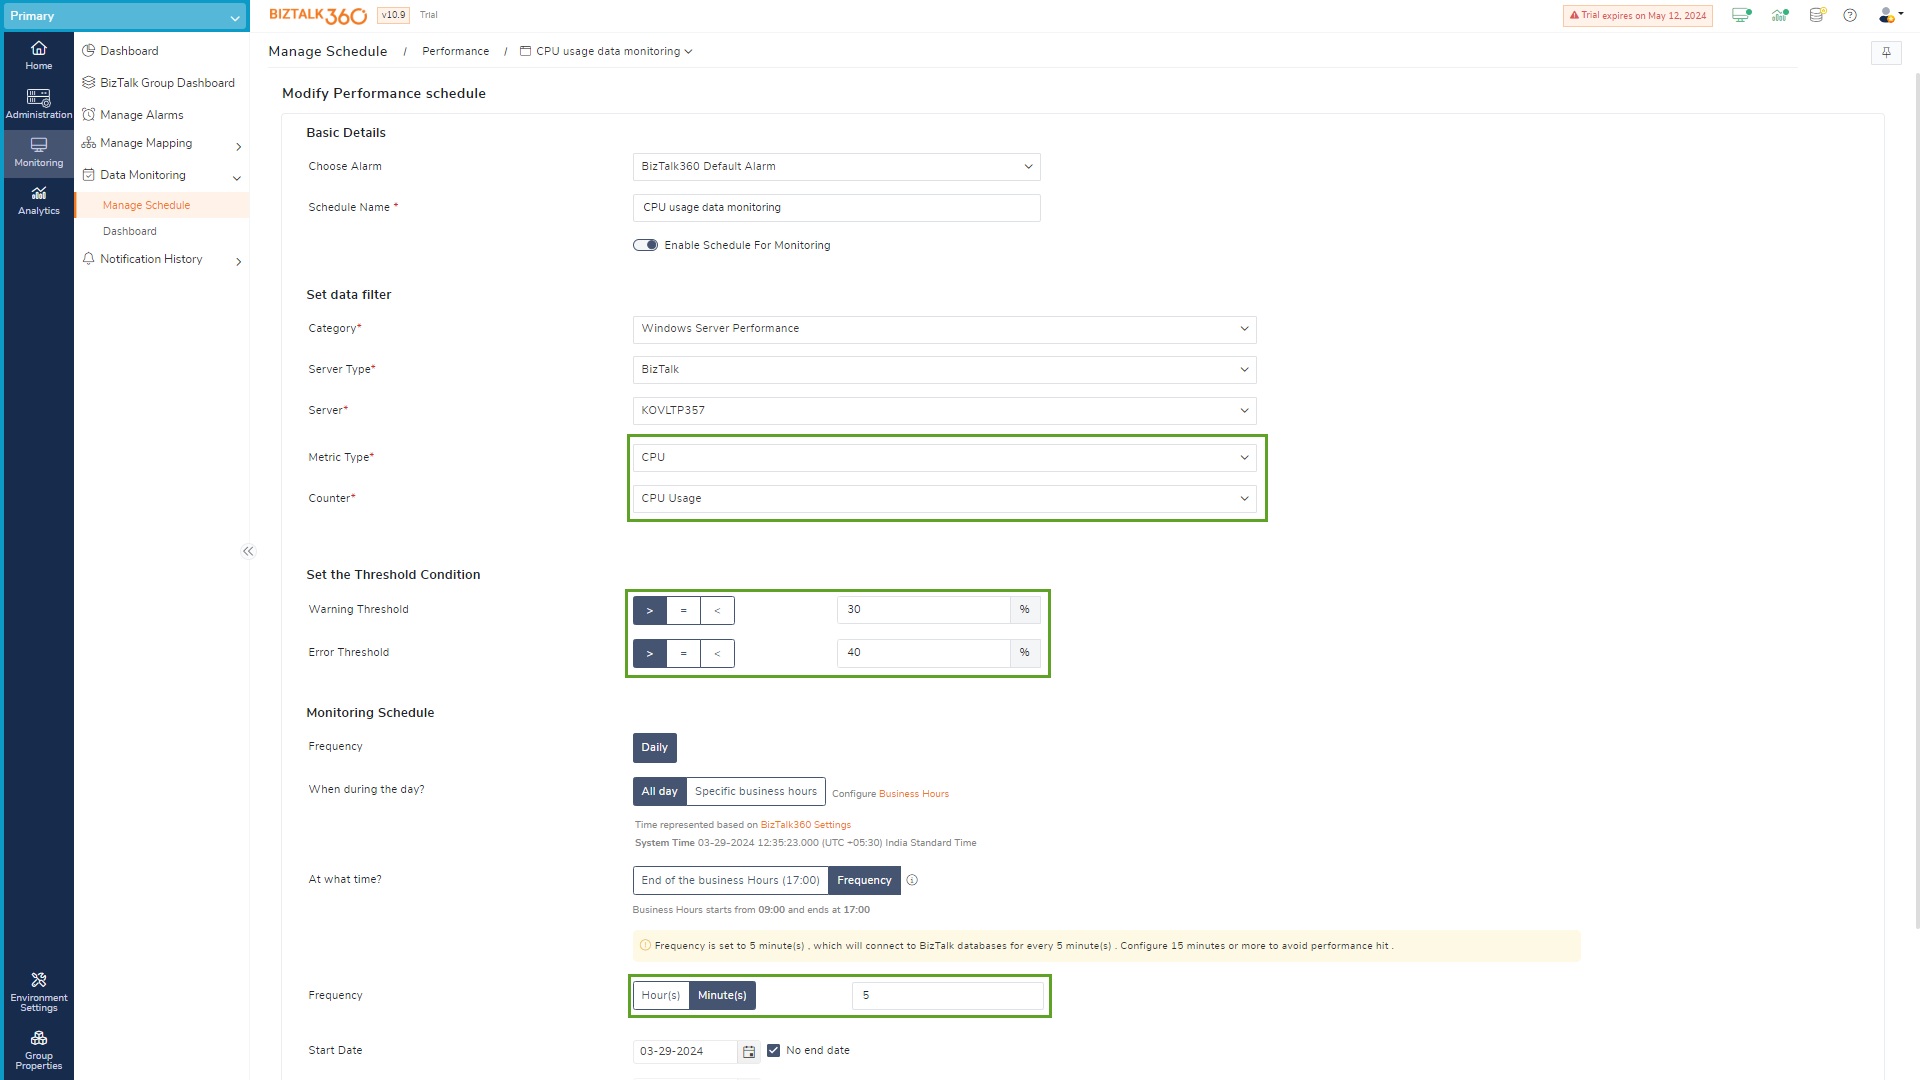
BizTalk360 automatically retrieves the current CPU and memory usage of the BizTalk and SQL server(s). You can configure the BizTalk360, to alert you when the CPU and Memory go below the specified threshold percentages. The usage will be retrieved using the perfmon.
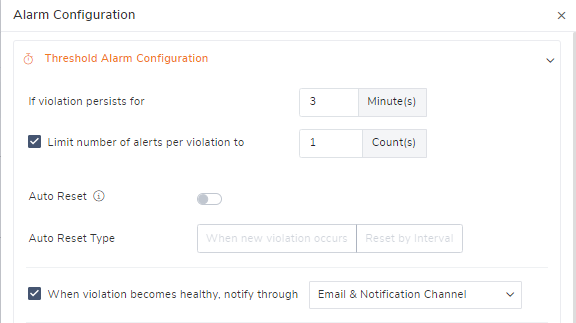
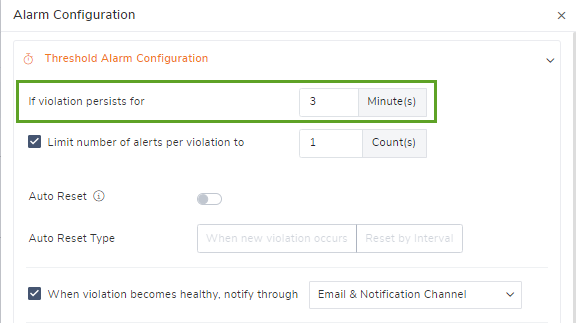
If the alarm is monitored in a 3-minute interval and within the 3 minutes at any point of time if the threshold limit breaches the violation, you will receive an alert based on the conditions. It helps to understand there is a spike and take the necessary action by the Network or Windows administrator.
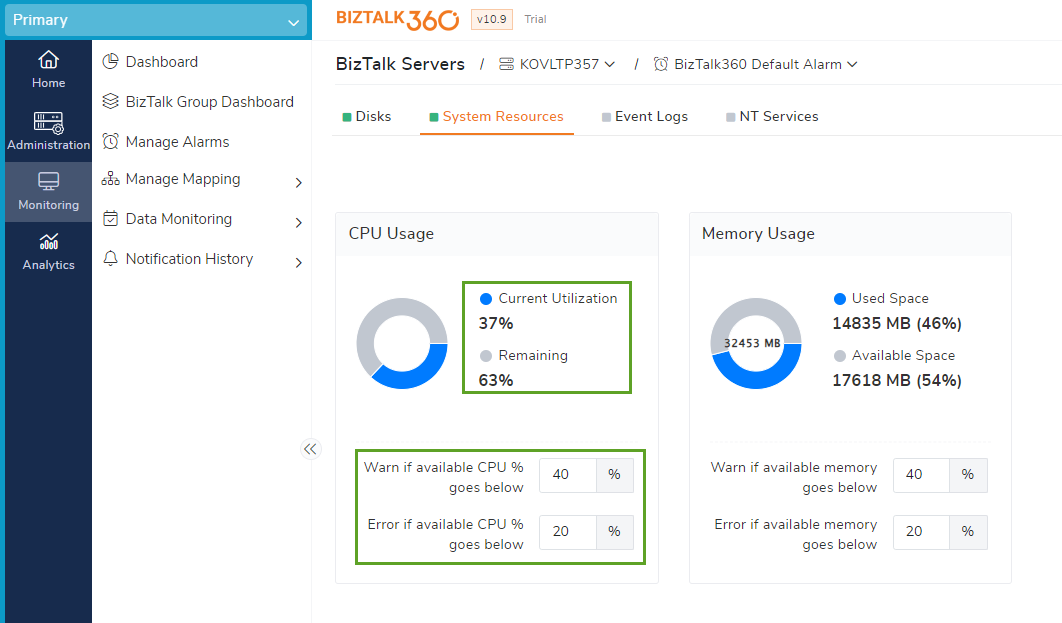
In the above screenshot is shown that the BizTalk Server needs to be monitored for high CPU and memory usage. A Warning notification should be received in case the available CPU goes below 40% and an Error notification should be received in case the available CPU goes below 20%.
We are planning to improve the CPU utilization feature in the upcoming future release. But as per the current behaviour, at the monitoring execution time based on values with the range of 5 milliseconds, if the threshold limit breaches the violation, you will receive an alert based on the conditions. However, the customer is expecting a feature that can help in CPU monitoring if there is a violation that persists for the given time and raises it through any notification channels.
Example: If the CPU availability goes below 20% and if it persists for 3 minutes then raise a down alert with an Error message.
Before getting into the suggestions provided, let us understand how the BizTalk360 monitoring service works. The BizTalk360 monitoring service will collect the CPU utilisation from all the machines within the environment using the performance monitoring tool (perfmon.exe) and store the data in the BizTalk360 database. Let us have a look at how the monitoring service collects the data.
For every minute, the monitoring service will check.
If the alarm persists, the duration time is set to 10 minutes. It will monitor for 10 minutes and if any entry hits the threshold value for a second. It will send an alert. The alarm will not only send an alert if the threshold value persists for 10 minutes, but even if it hits a second, it will raise an alert.
Note: Since the BizTalk360 is picking up the top 3 spikes, the actual CPU usage and the BizTalk360 CPU usage that is shown in the UI (User Interface) will be different. The BizTalk360 CPU utilization shown will be higher comparatively because it is picking up the top 3 spikes and not considering the lows. But the customer is looking for a different option.
As we have mentioned before, Importantly, we are planning to improve the CPU utilization feature in the upcoming future release.
As I have mentioned earlier, the CPU monitoring is designed in a way, that, if the alarm is monitored in a 3-minute interval and within the 3 minutes at any point of time if the threshold limit breaches the violation, you will receive an alert based on the conditions.
BizTalk360 is built in a flexible way where you can use other features and achieve the same results. To overcome this challenge, we have provided the best possible suggestions, and we are sharing them with you now.
We are going to use the SQL query using a data monitoring feature to achieve this scenario with a limitation of timings. Follow the steps.
It will collect the data for the last 5 minutes and if the CPU is greater than 80.
a) Replace server name ‘Server_Name’ with the Server Name they want to monitor.
b) Minute, -5: Last 5 minutes, this can be modified.
c) Value > 8: CPU utilization value, this can be modified.
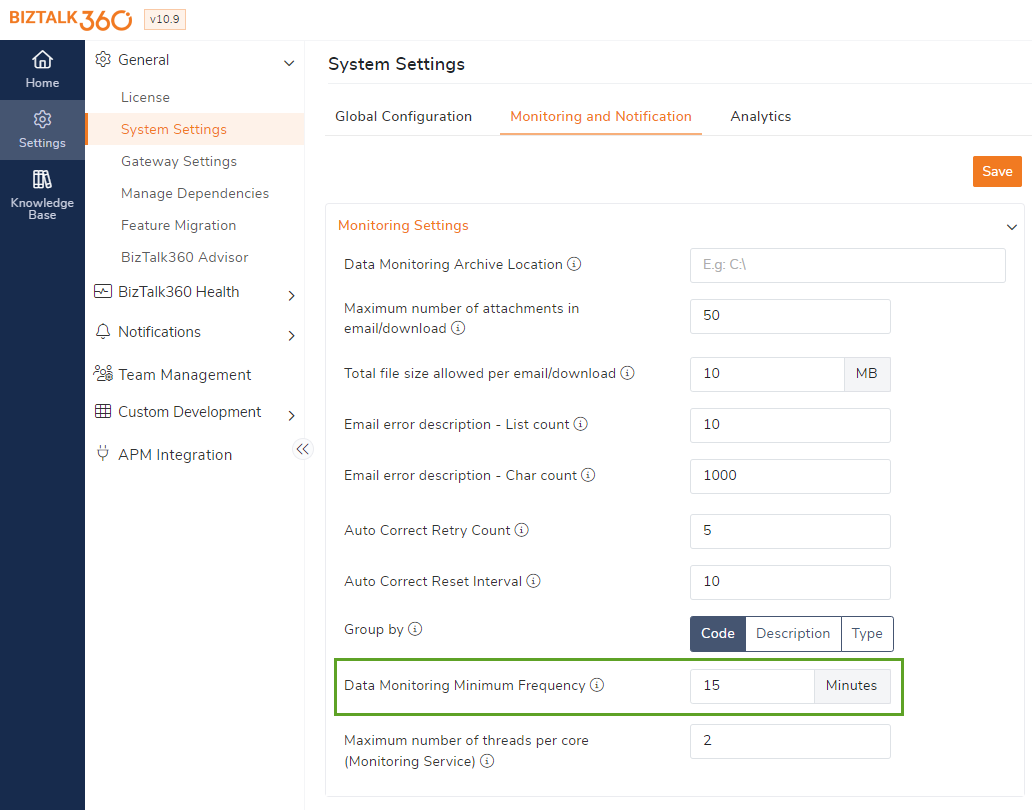
Since the Data Monitoring Minimum Frequency cannot be set below 5 minutes, hence set it to 5 minutes. If the CPU peaks > 80% 3 times in the last 5 minutes, then the query returns the value as 3. With this, you can know the CPU has peaked for 3 minutes. If it returns as 2, then you can understand it is not prolonged for 3 minutes it only occupied for 2 minutes or below.
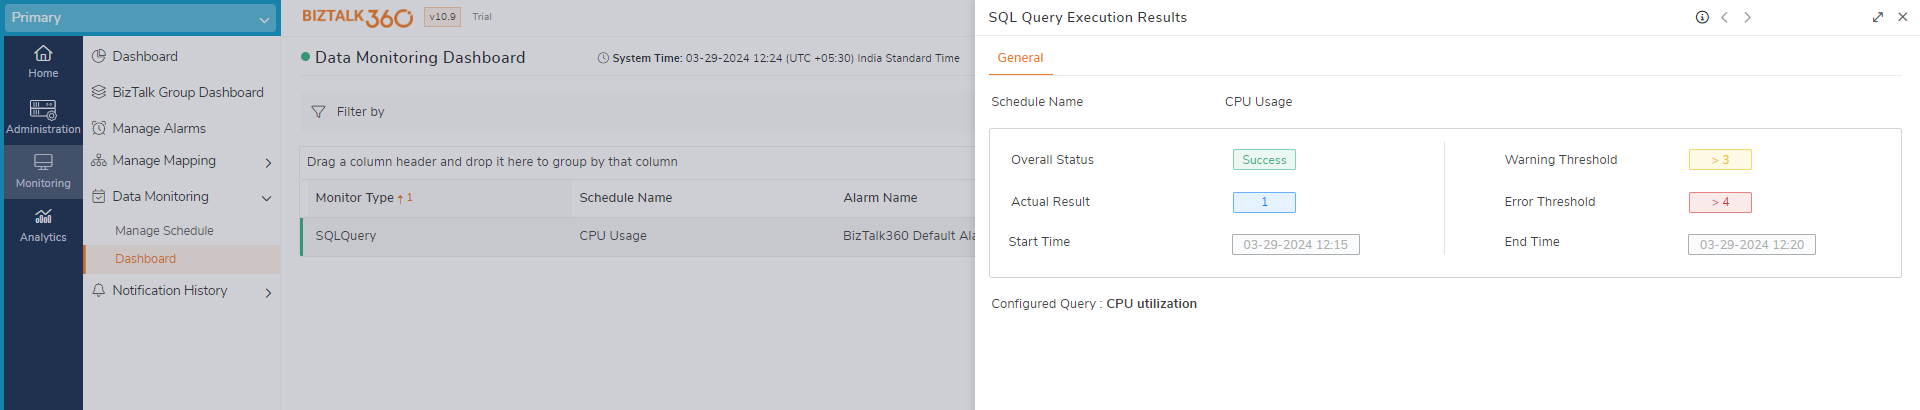
Here the query value returned as 1, hence it does not meet the threshold value. Hence it is healthy.
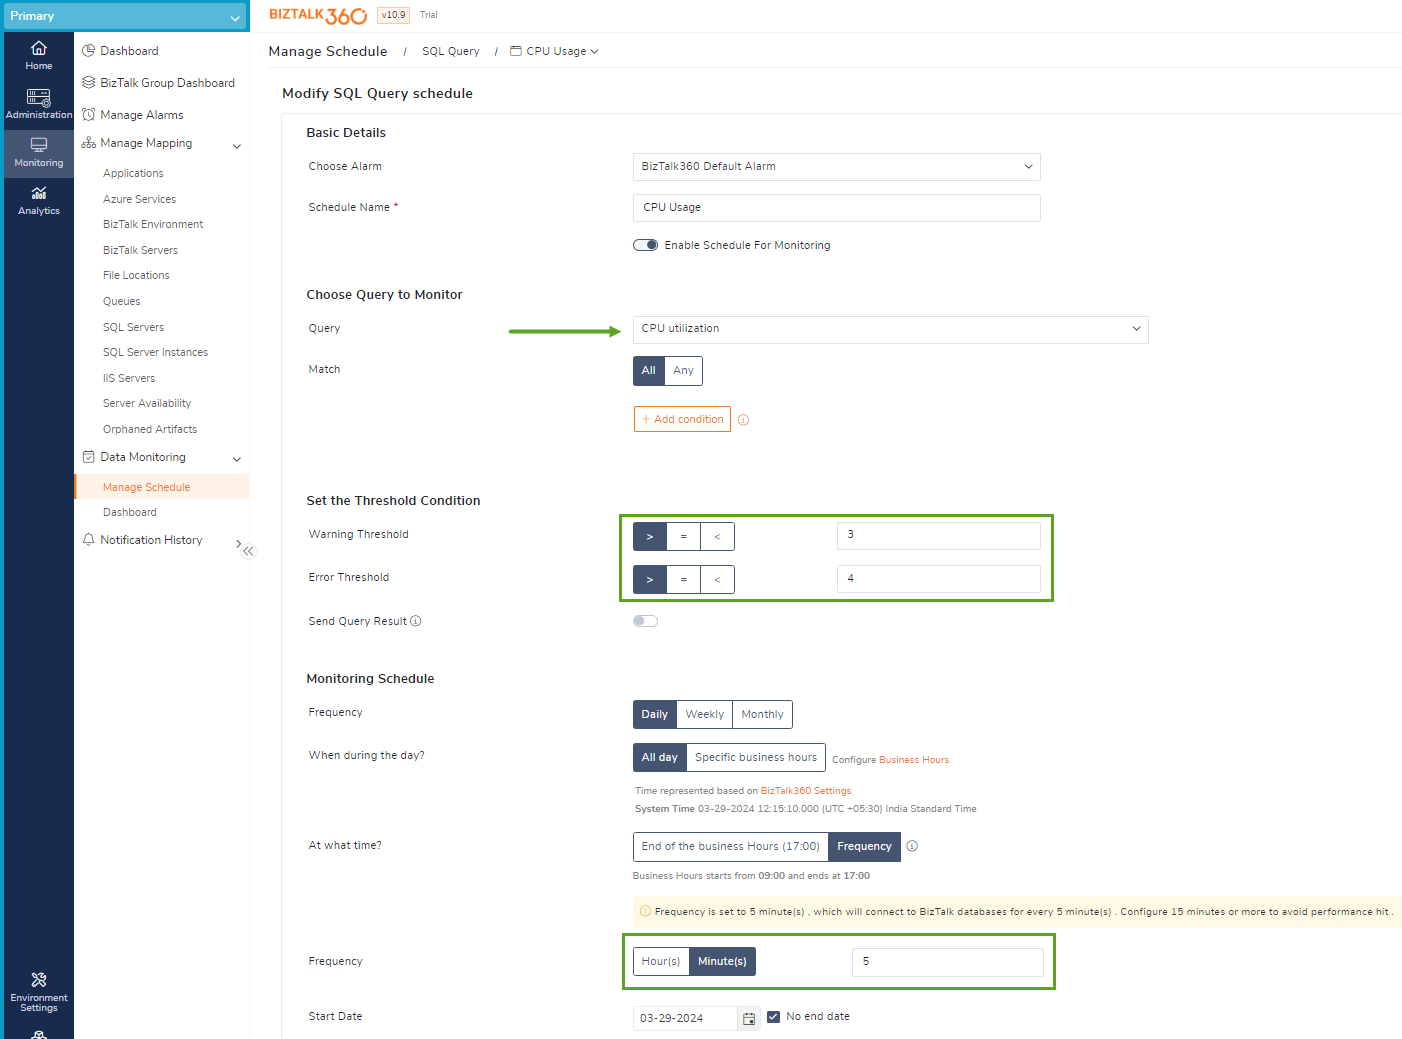
We are going to use the same SQL query using a threshold monitoring feature to achieve this scenario. To attain this, follow the steps.
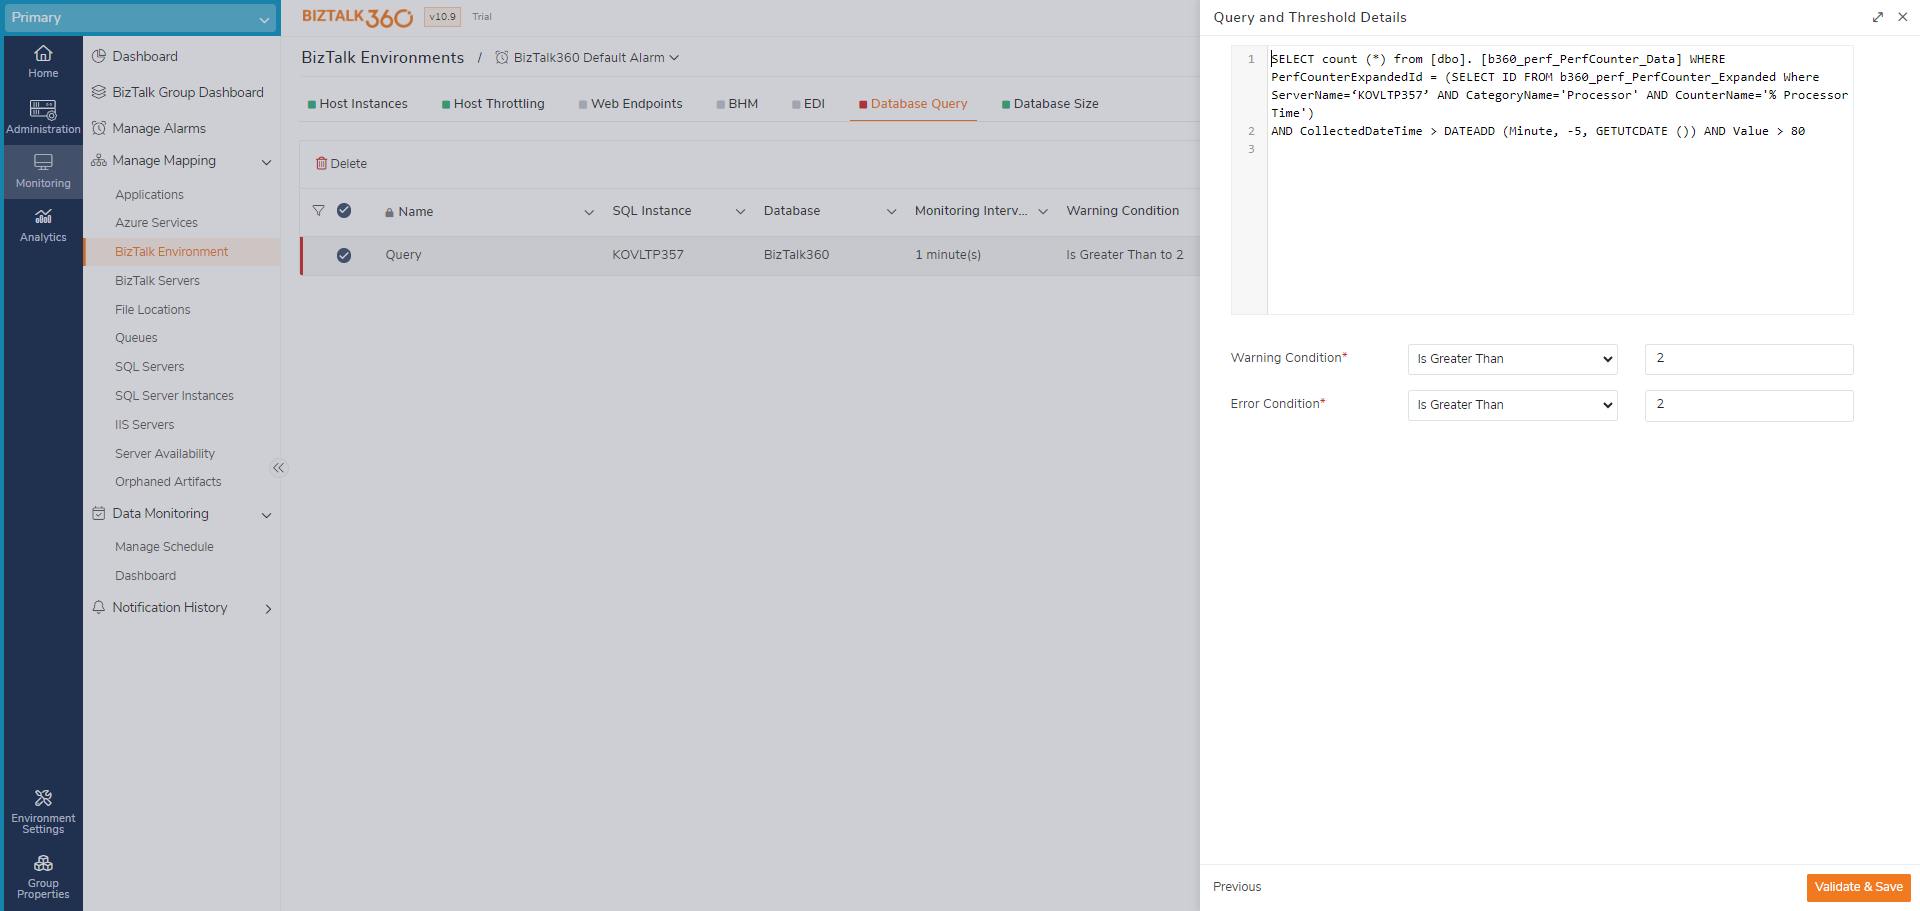
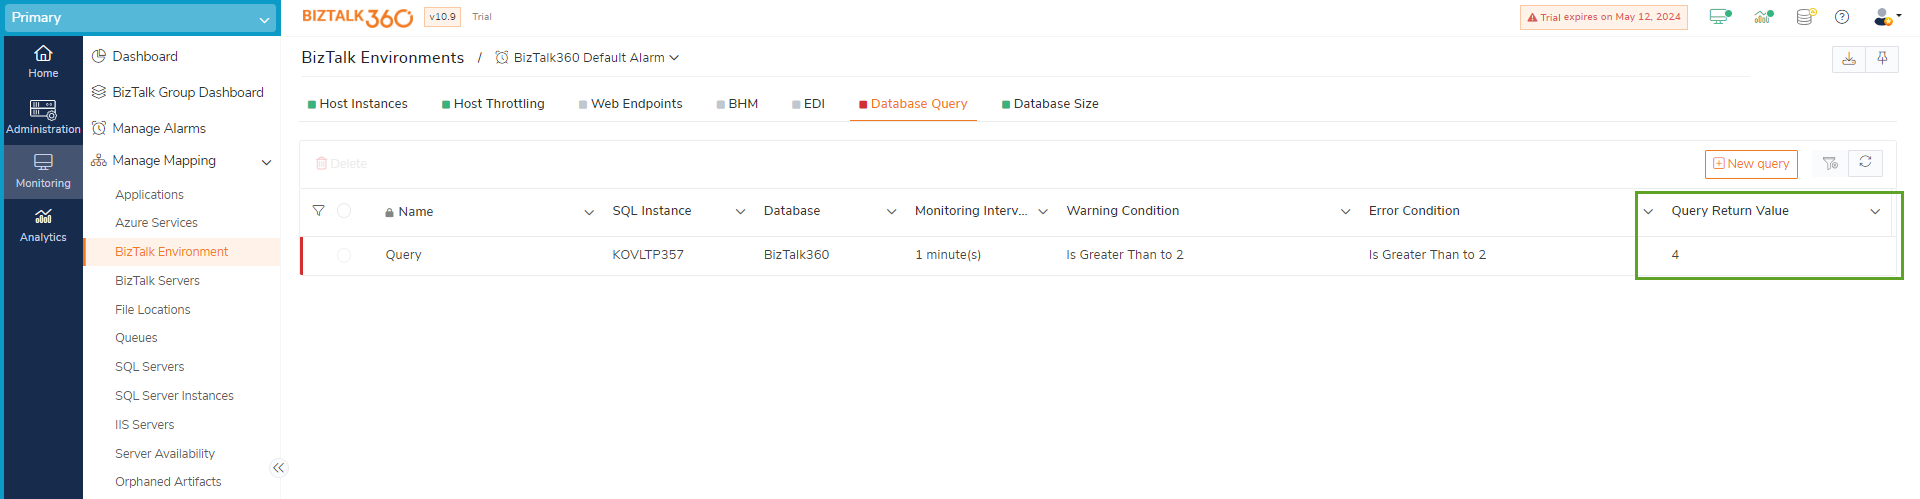
If the CPU peaks > 80% 3 times in the last 5 minutes, then the query returns the value as 3. With this, you can know the CPU has peaked for 3 minutes. If it returns as 2, then you can understand it is not prolonged for 3 minutes it only occupied for 2 minutes or below.
For now, the query returns the value as ‘0’ in the grid. Hence it is healthy.
You can monitor CPU or Memory usage for the last 5 minutes using this performance data monitoring with the limitation of timings.
Alerts will be sent based on the average value of the last 5 minutes. For the last 5 minutes, we will have 5 entries in a database, we will get the average of those as results.
Since we have 3 different suggestions, the results will be also different. A couple of suggestions were based on the data monitoring and the minimum time can be set to 5 minutes as mentioned before.
Since the customer requirement is to monitor CPU and when the violation is prolonged for 3 minutes then they want to receive the alerts. Hence, we have suggested Suggestion B: Alert Based on Occurrence – Threshold Monitoring (SQL Query).
The above query that we have provided is a sample one, based on the sample query, you can add more values for the results and use the advantages of features of SQL data monitoring and SQL Query monitoring.
The customer has an SQL query that will generate a list of suspended messages in a table format. They used a Secure SQL query to see the results. Now, they want to execute that query automatically and send the results in an email to the distribution list.
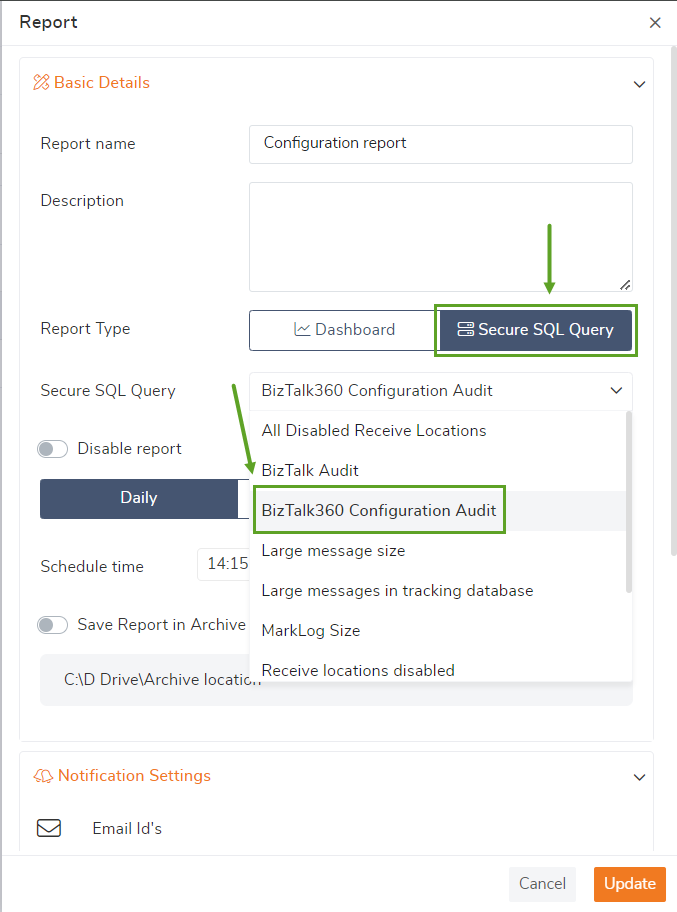
Using the Analytics reports with the option of choosing a Secure SQL Query, the query results can be sent in an email as an attachment.
a) Choose the report type as Secure SQL Query and choose the query using the drop-down menu.
b) Choose the notification channel, set the scheduled time, and save the configuration.
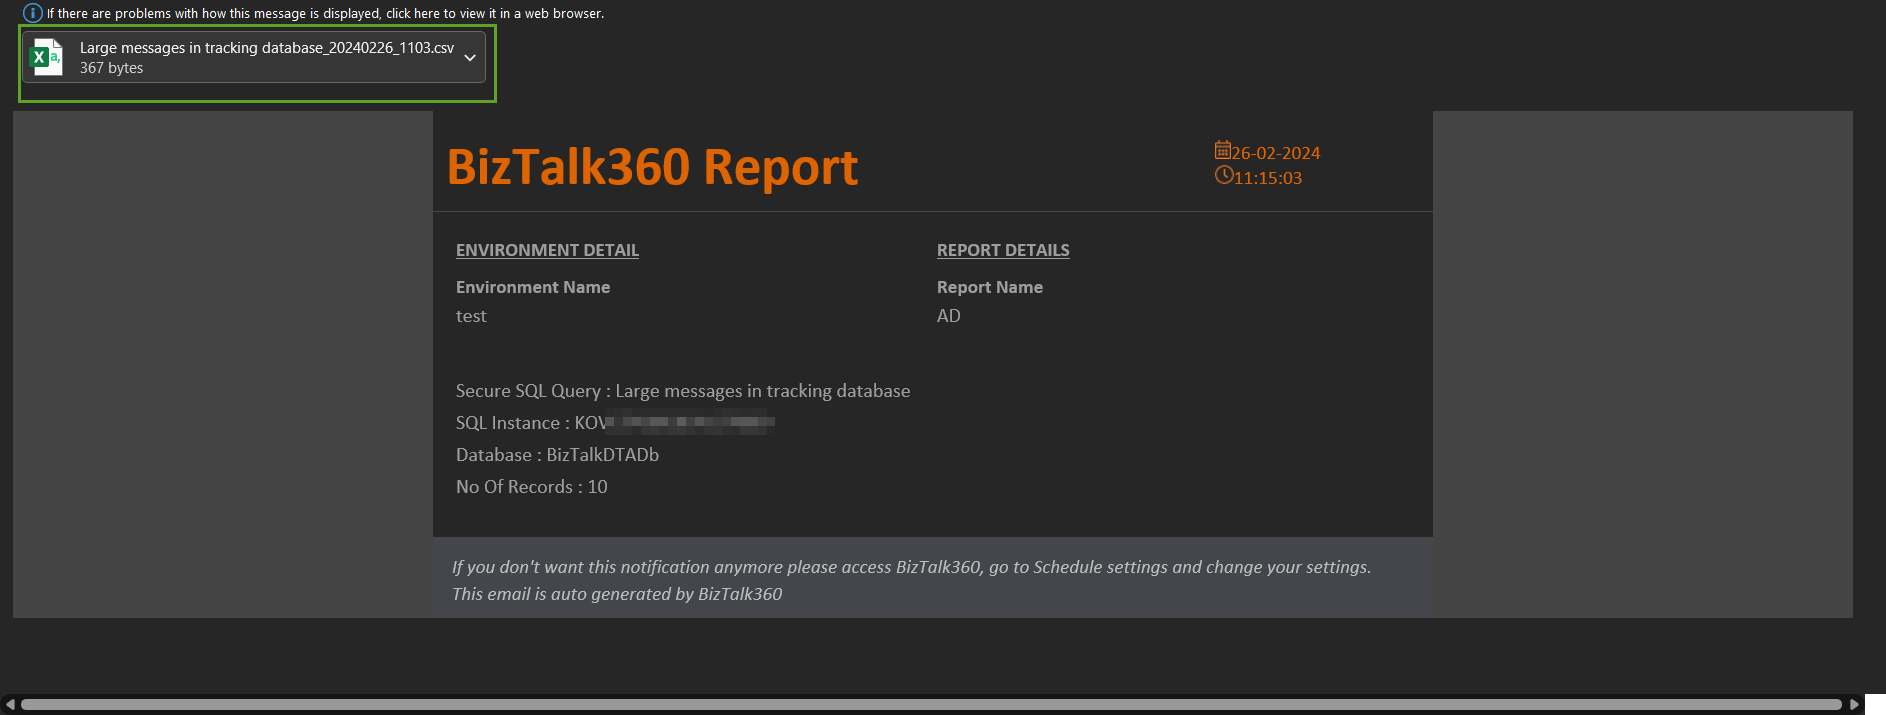
An email will be sent with an attachment, with a result of Secure SQL queries.
Another customer came-up with an interesting request. When the suspended count of an application reached to 100, they wanted to stop the receive location automatically. After a day they will check the messages and start the receive location manually.
By using the Threshold monitoring we will monitor the Application’s instance count and using PowerShell notification channel we shall perform the actions like Stopping the Receive location. As a prerequisite create a PowerShell script to stop the receive location and configure a PowerShell notification channel.
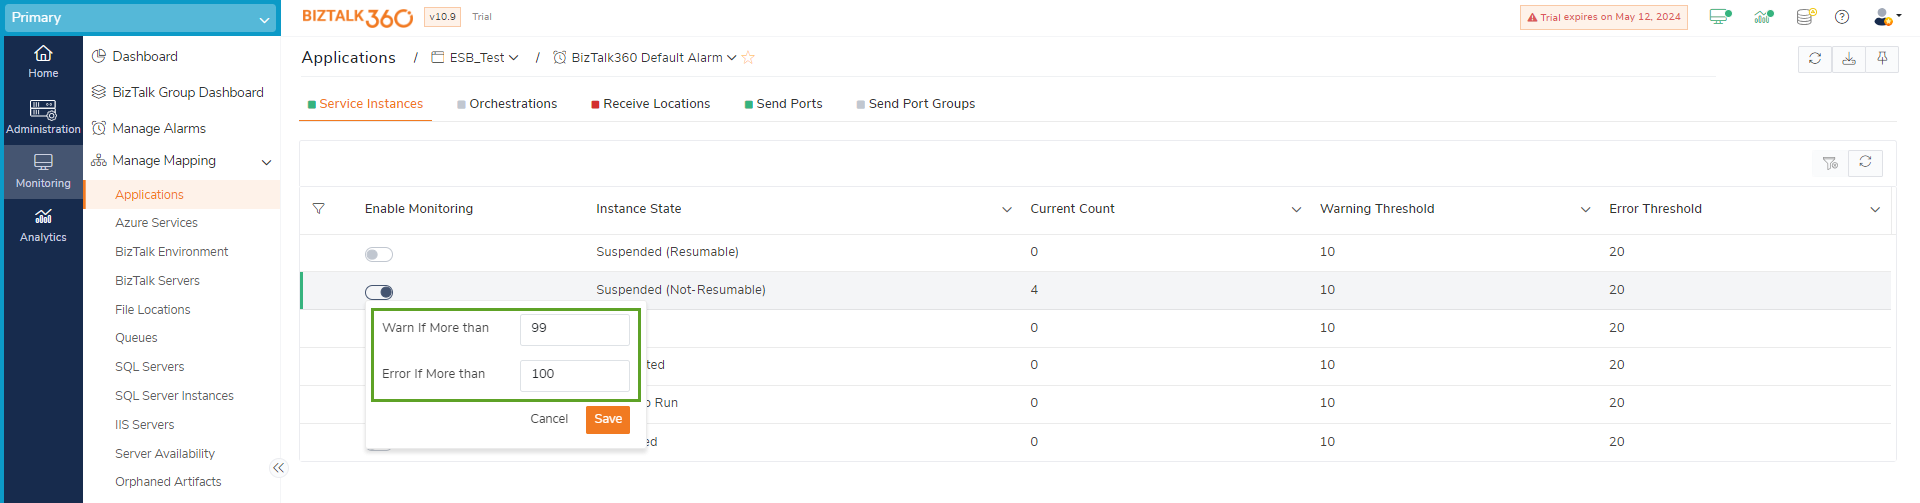
So, whenever the suspended count reaches 99, the BizTalk360 will hit the PowerShell notification channel, the script will get executed and the receive location will be stopped.
Using this method, we further go one more step down and monitor the receive/send location. Follow the steps till 2 and the prerequisites are still applicable here too.
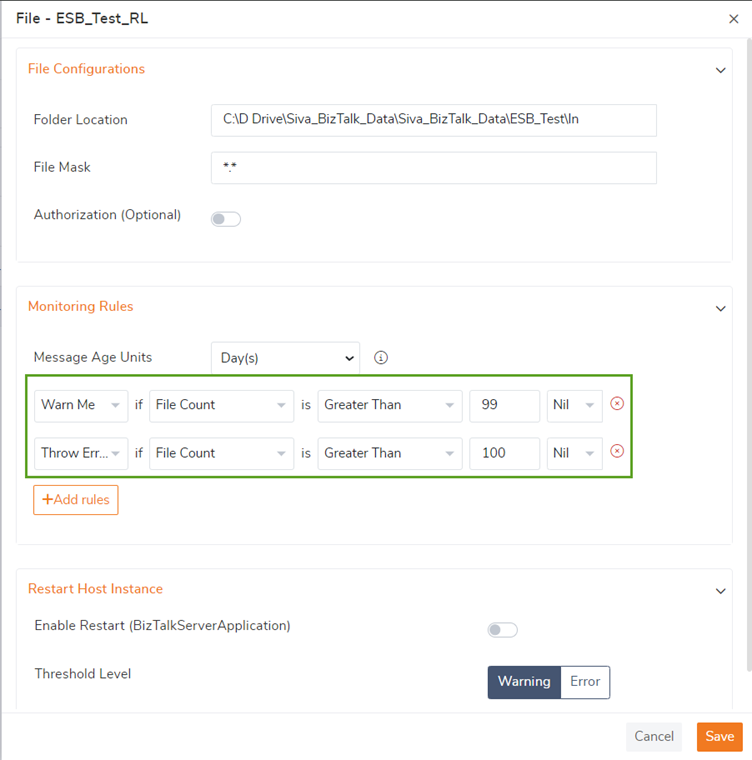
Here, whenever the Receive location’s suspended count reaches 99, the BizTalk360 will hit the PowerShell notification channel, the script will get executed and the receive location will be stopped.
Using the message box data monitoring, we can monitor the exact receive location.
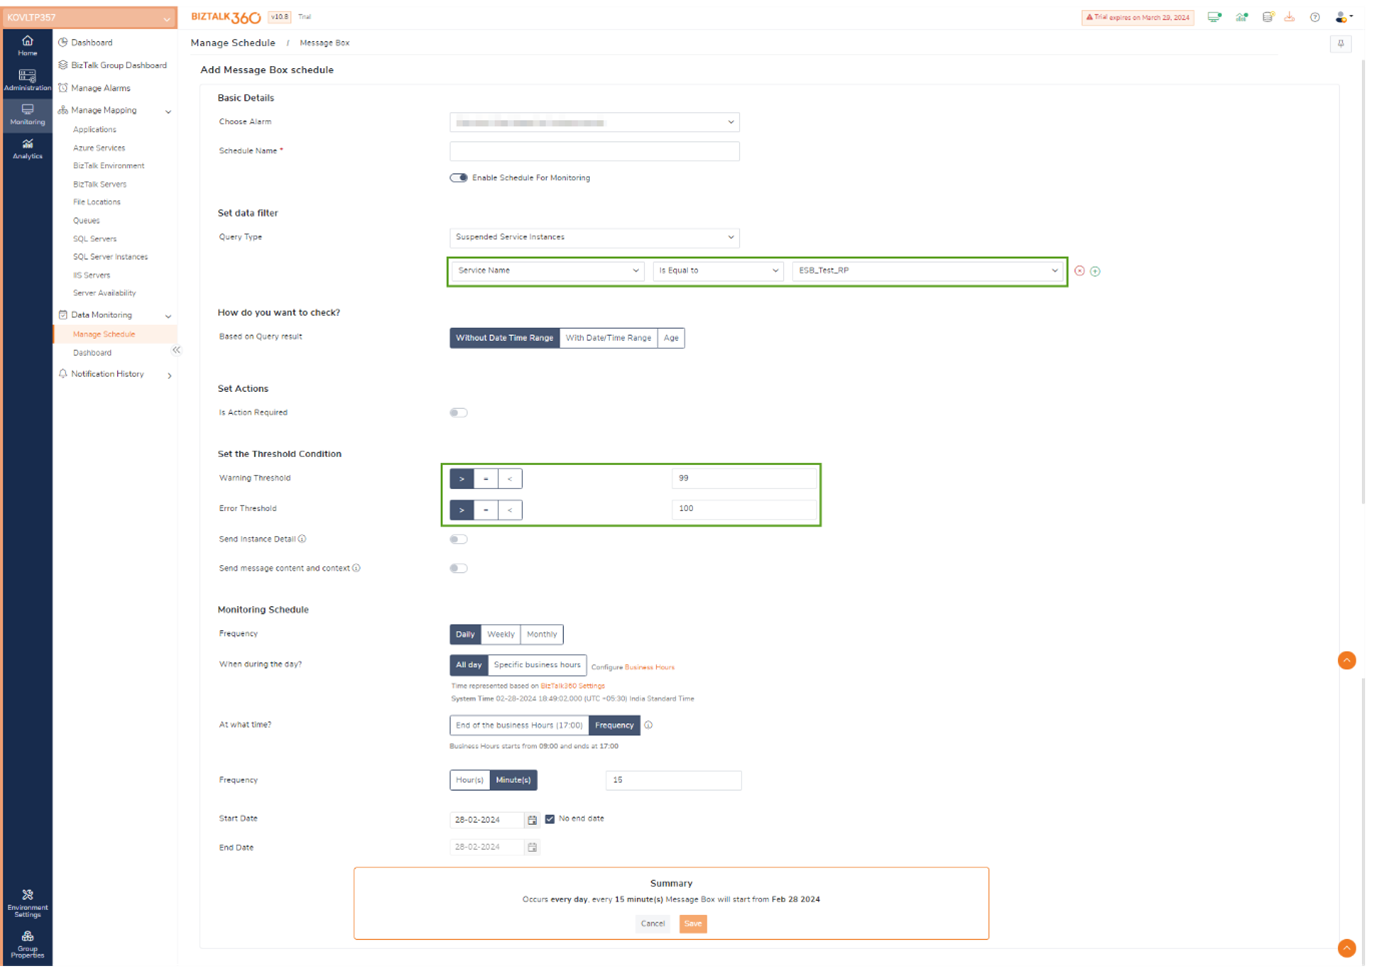
Based on the above configuration, for every 15 minutes the data monitoring will check the Receive location, whenever the suspended instance count reaches to the threshold condition the BizTalk360 will hit the PowerShell notification channel, the script will get executed and the receive location will be stopped.
We hope this bog gives you more information about how BizTalk360 efficiently manages the support of the other components to support the smooth functioning of BizTalk. BizTalk360 will be always one step towards the customers to reduce their pain points. We will always keep improving the customer experience and benefits.