
Mekala
Author
Published on : Nov 23, 2022
Category : BizTalk Server
It is a struggle for every BizTalk DBA to manage their SQL databases in all aspects without the right SQL monitoring tool. Especially BizTalk databases which are the heart of the system. Any unnoticed small gap will impact the business heavily. So, it is very important for every DBA to monitor the database from a bird’s eye view. We will be looking into monitoring the specific important SQL job “Monitor BizTalk Server (BizTalkMgmtDb)”.
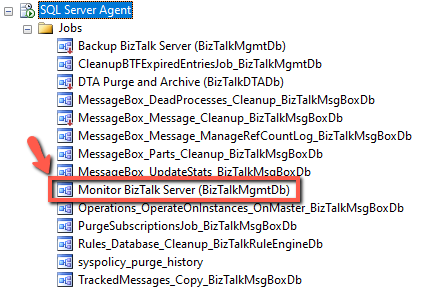
In BizTalk Server, there’s a job called Monitor BizTalk Server (BizTalkMgmtDb). This job checks the management and tracking databases and looks for any inconsistencies. If there are none then the job completes successfully. If there are inconsistencies, then the job fails. In this blog post, we will take a detailed look at how BizTalk360 helps monitor the SQL jobs and ensures the proper – time alert notification to the business for smooth business flow.
The Monitor BizTalk Server job scans for issues but does not fix them for you! It consists of two steps.
Although this job does not fix any issues, you can leverage this job by creating a monitoring solution or altering the mechanism for administrators so they can act on any issues. This does mean customizations on your part. Either by leveraging the alert or notification capabilities of SQL Server Jobs or by for instance creating a view that shows any issues. Without tools like BizTalk360, it is difficult for the SQL and BizTalk Administrators to customize the alert and notification mechanism.
The user of the BizTalk Terminator tool can quickly fix common BizTalk issues by using the SQL, WMI, and PowerShell tasks given by the BizTalk team. Additional capabilities include changing performance preferences, terminating in bulk, suspending, resuming, and integrating the ability to change performance preferences, terminate in bulk, suspend, resume, and integrate with the BHM tool.
Run BizTalk Terminator to resolve the problems the job found. You may find the free download by searching on Microsoft.com.
Additionally, BizTalk Health Monitor (BHM) is a fantastic tool for getting more detailed assistance and information when, for instance, Biztalk SQL Jobs fail.
The Terminator tool, now known as Maintenance, is also included in BHM.
Use BHM to launch the maintenance tool
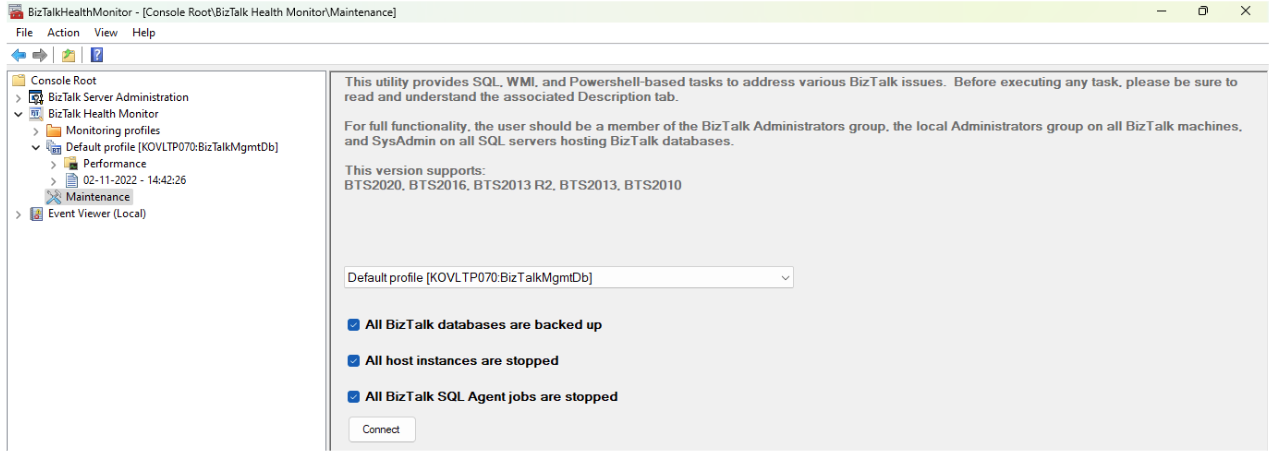
Always check that you have a BizTalk backup of your databases, that all BTS hosts have been stopped, and that BTS SQL Agent jobs have been disabled before executing the tool.
In BHM run Analyse Now on the default profile
After performing the above steps now, you can create a new BHM report and confirm issues are resolved.
Though it is a powerful functionality, but there are some challenges for the BizTalk administrators in using the BizTalk Health Monitor.
By overcoming the aforementioned challenges, the BizTalk360, a monitoring tool, can be used to run the BHM and monitor the health of the environment.
The key aspect here is that BizTalk360 not only allows you to perform all the activities, but it also allows you to perform a health check on multiple BHM profiles at any time and day.
We will see all those capabilities one by one in coming sections.
As a unified platform for administration, monitoring, and analytics for your BizTalk Server, BizTalk360 eliminates the need for manual BHM runs to identify the root cause of these issues. Powerful functionality in BizTalk360 can help you handle all of these issues and manage your business with ease.
Monitoring your BizTalk Server Job, how?
You can utilize BizTalk360 to perform all possible actions, such as Start, Stop, Pause, and Restart, just like you would do with a service.msc terminal. Users can perform the activities without switching contexts to your server’s services window. Similarly, you can use BizTalk360 to keep an eye on the NT Services.
Additionally, the user may view the history of jobs on a single page using SQL Jobs History in BizTalk360 rather than visiting SQL Server Management Studio to obtain the same information. The most recent records of completed jobs are presented under the SQL Jobs History tab according to the maximum number of records chosen.
Check out the link to learn more about this ability.
In addition to monitoring your BizTalk SQL Jobs, BizTalk360 also enables monitoring of your BizTalk databases. You can set a threshold limit for database scalar values by using our database query monitoring feature. The monitoring service will compare the outcomes of a SQL query against set threshold values for each BizTalk360 Monitoring cycle. In the event of a violation, the configured emails in the alarms will receive a notification.
Another choice for monitoring database files is Custom Widgets. You can tailor the solution you desire for your daily tasks using the intuitive Dashboard features. The tool will assist you in monitoring all the BizTalk Server databases -if you are interested in doing so.
To know more about this capability, refer to the below blog post.
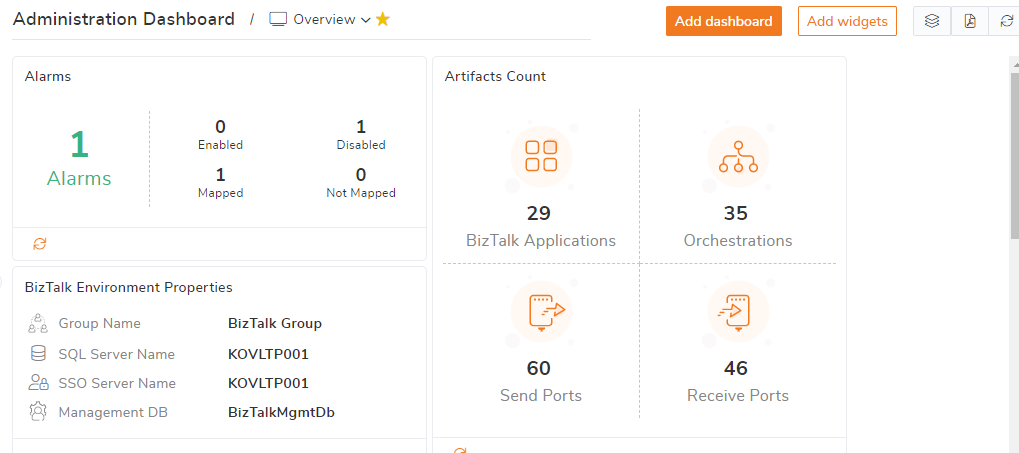
This is the application’s home screen; when you access an environment, you are shown the environment dashboard, which displays several system components and their state of health. It displays information on the number of hosts, apps, message boxes, and other important components of the environment. Indicating their respective health status, green denotes health and red indicate an error.
All such information will be shown in the default dashboard, and you are free to create your own dashboards as well.
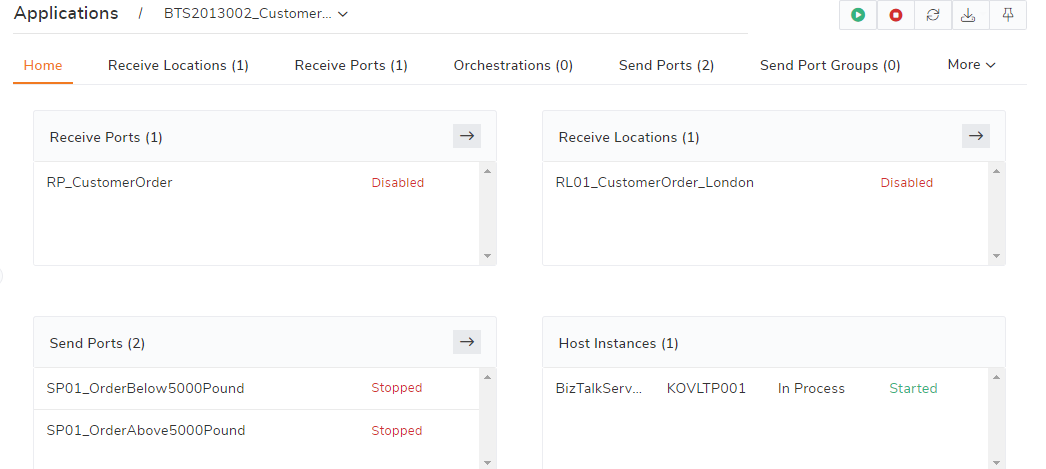
This is another dashboard. A single view into a certain BizTalk application is provided via the BizTalk application dashboard. The heading of the artifacts is colour coded to indicate their general condition. On the dashboard, any suspended instances will be highlighted.
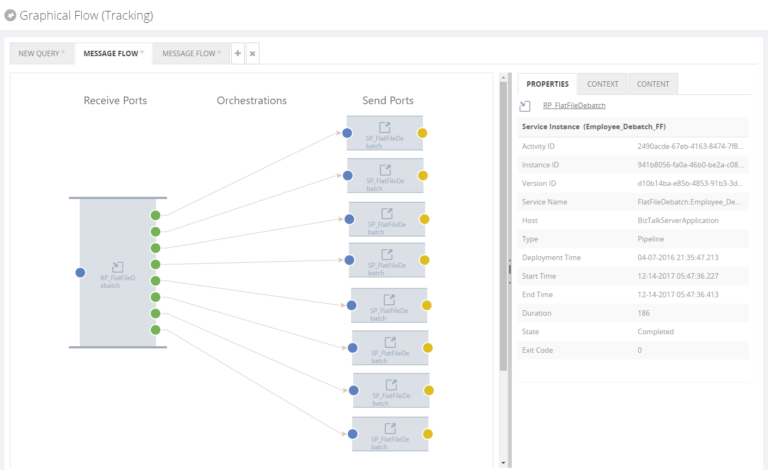
Have you ever struggled to understand how messages flow via the BizTalk system? Particularly if your system is complicated and messages must flow through a number of orchestrations inside the BizTalk system. Understanding the end-to-end message flow structure becomes significantly more difficult if you need to identify a message-specific issue. BizTalk360’s graphical flow tracking feature helps to understand the simple to complex message flow scenarios in a simplified way.
You want to finely manage user’s access, if you are running one of your critical applications on a BizTalk server. One of your junior analysts working on the application shouldn’t have administrator access to the live environment. You want to be able to:
All of these needs are effortlessly met by BizTalk360, which has a complete admin interface for management and auditing.
The biggest problem is that there is no tooling in the system to track “who did what.” It’s crucial to log this information in a production application for a number of reasons. BizTalk360 handles everything without a glitch and offers views right out of the box to put this data at your fingers.
Monitoring is the out-of-the-box capability BizTalk360 provides. Here below I have highlighted the important highlights of the monitoring feature.
Managing EDI parties and agreements, Azure Service Bus Administration, Schedule Service Window setting for Ports and Automated Tasks for Logic Apps, IIS App pool operations, and PowerShell execution are just a few of the interesting capabilities we have to offer.
To know more about the features and capabilities of our recent release please refer to our release notes.
Using this blog, we hope to have explained the breadth and length of features and capabilities offered by this tool, as well as how BizTalk DBAs may use them to manage BizTalk360 efficiently. Use trial keys for 30 days to explore all the features.