In 2017, we released 4 major releases and 3 patch releases of BizTalk360 with various new capabilities, usability improvements and bug fixes. We wanted to summarize the 15 best features we released in 2017 in this blog
1. EDI Capabilities
We enhanced the Electronic Data Interchange (EDI) capabilities of BizTalk360 with new features such as —
- EDI Reporting Manager
- EDI Reporting Dashboard
- EDI Functional Acknowledgement Status
EDI Reporting Manager
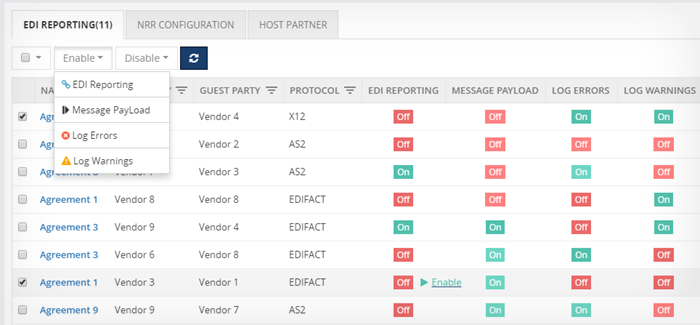
With the EDI reporting manager capability, you can turn on/off reporting for each agreement in a single click. This becomes a very tedious process when performed using the BizTalk Administration Console (BAC), especially when there are multiple EDI parties and agreements. Users can also perform bulk enable/disable operations on the NRR configuration. Administrators have the option of adding the Host Partner information that is required to configure the host party for NRR configurations.
EDI Reporting Dashboard
We added a rich out-of-the-box
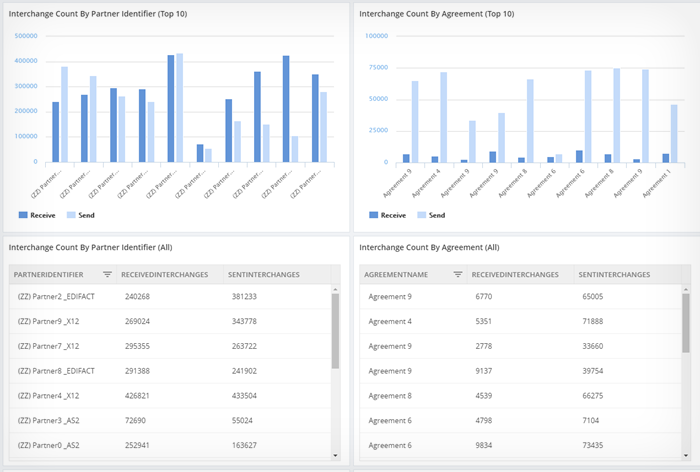
EDI dashboard that will aggregate the different EDI transactions to help business users to visualize the EDI data in a better way. The different widgets available in the EDI Reporting Dashboard are EDI Interchange Aggregation widgets, EDI Transaction Set aggregation widgets, AS2 messaging aggregation reports.
We also added few new aggregations (as widgets) that are not available in the BizTalk Administration Console such as Interchange Count by Agreement Name (Top 10), Interchange count by Partner Name (Top 10), Transaction count by ACK Status (Filtered by partner id), AS2 messaging aggregation reports.
EDI Functional Acknowledgement Status
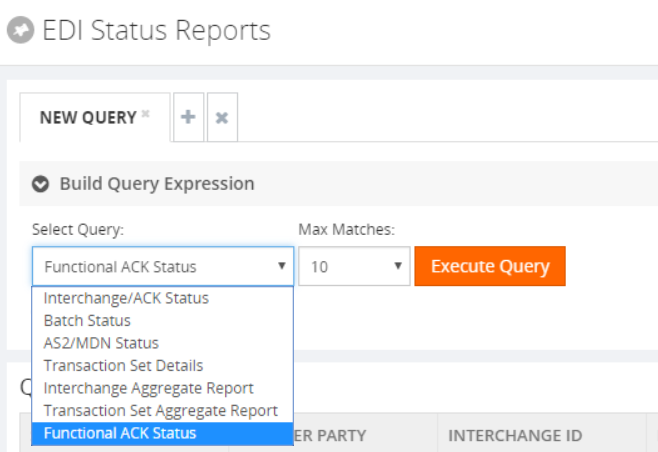
In any common B2B scenario, when a message is sent from the source to destination, an ACK will be sent back to the source with the status of the message (say, a technical acknowledgment TA1 or 997 functional ACK). Say, a message is sent from source to destination and the TA1 ACK is successfully received, but the 997 functional ACK is not received. With BizTalk Administration Console, it is not easy to identify the reason why the 997 functional ACK was not received by the sender. BizTalk360 brings in the capability to allow administrators to easily view the status of functional ACK within the UI and set up data monitoring alerts to get notified of negative functional ACKs.


2. ESB Dashboard
We added a new
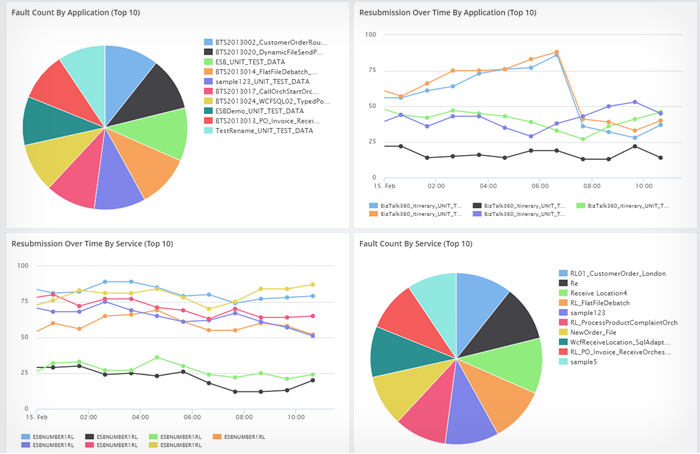
ESB Dashboard that will allow users to aggregate ESB reports into a single graphical dashboard. There are total 13 widgets that will help users understand their ESB integrations and to better analyse the data to improve performance. The widgets are categorized into 3 groups — Fault code widgets (based on application, service or error type), Fault code over time widgets, Itinerary Widgets.
3. Notification Channels (Webhook, Microsoft Teams)
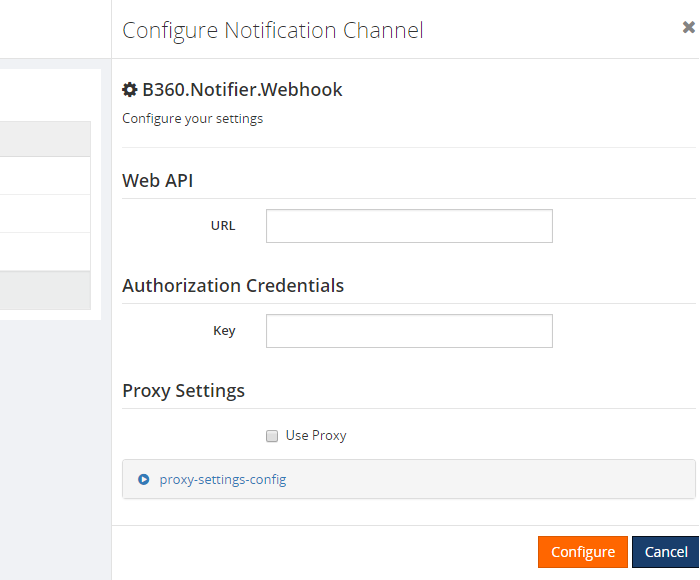
We added two new notification channels — Webhook and Microsoft Teams in addition to the existing notification channels such as Email, HP Operations Manager, Slack, ServiceNow. The new
webhook notification channel allows you to send structured alert notifications (JSON format) to any REST endpoints whenever there is a monitoring violation.
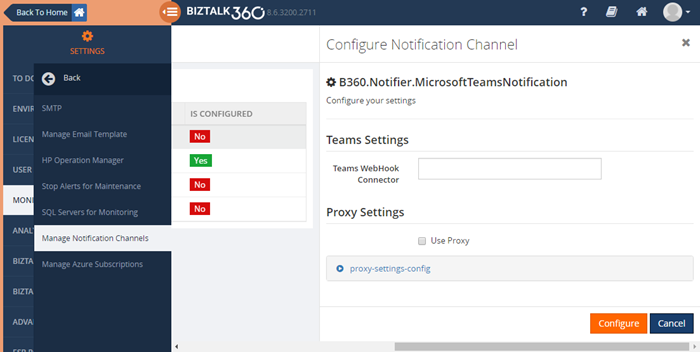
Additionally, users can now connect a
Microsoft Teams channel to their respective BizTalk360 alarms with the proper Webhook URL and receive alert notifications directly to their Teams channel.
4. Azure Logic Apps (Operations, Data Monitoring)
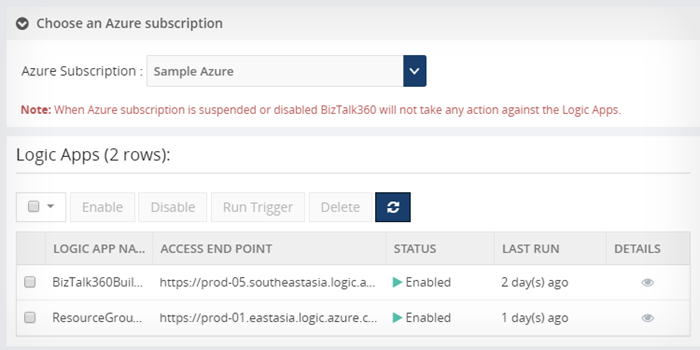
We brought in the capability into BizTalk360 to be able to manage and monitor the Azure Logic Apps. Therefore, if you are using only the Logic Apps offering from Azure, you need not switch to Azure Portal to manage your Logic App. You can perform all operations on the Logic App such as Enable, Disable, Run Trigger, and Delete. The Trigger history and Run history details are available in both graphical and grid view.
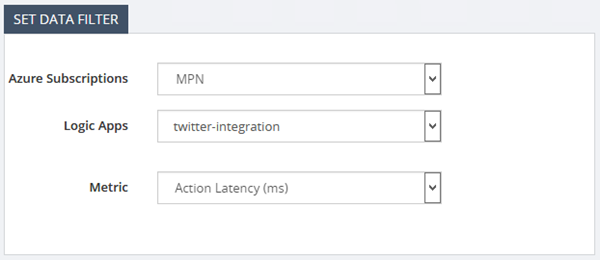
In addition to Logic App Operational capabilities, users can configure Data monitoring to monitor and trigger alerts based on historical events.
5. IBM MQ Monitoring
In addition to MSMQ and Azure Service Bus Queue monitoring capabilities, we added the
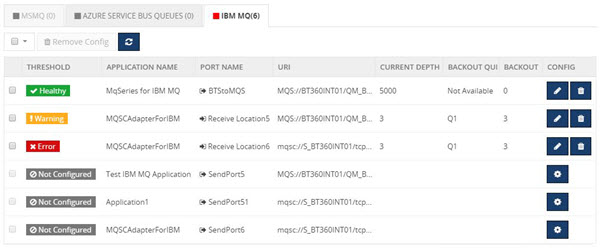
IBM MQ monitoring capability. IBM MQ monitoring supports both MQSC and MQS based configurations; you can monitor for the following 4 parameters – queue depth, backout queue depth, queue usage percentage and backout queue percentage.
6. Folder Monitoring, FTP/FTPS/SFTP Monitoring
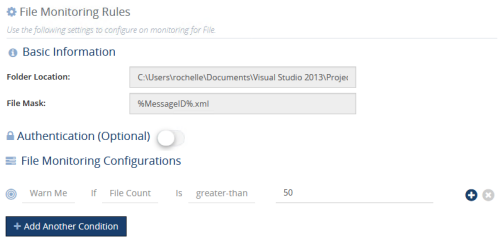
With BizTalk360, we wanted to make monitoring of BizTalk resources very seamless in order to differentiate BizTalk360 from other general purpose monitoring solutions. We introduced the capability of Folder monitoring where users get to view all the configured receive locations and send ports that make use of the FILE Adapter and configure monitoring on those specific folders.
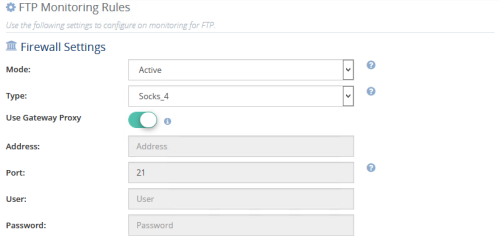
Similar to Folder monitoring, BizTalk360 also supports the monitoring of FTP, FTPS and SFTP adapters. The main purpose of configuring monitoring of these adapters is to monitor for data pile up!
7. Infrastructure Settings – New Additions
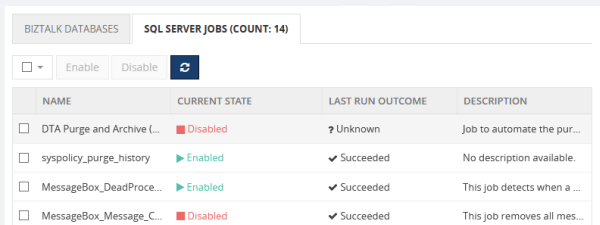
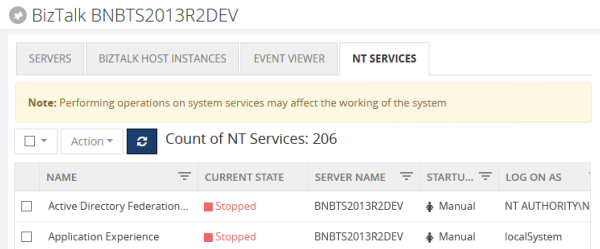
We added new options to the Infrastructure Settings — BizTalk and SQL NT Services and SQL Server Jobs. Users can perform operations like Start, Stop, Restart, Pause and Resume on the BizTalk and SQL NT Services. Similarly, users can manage SQL Server Jobs (start and stop SQL jobs) in BizTalk360.
8. BizTalk Server Licensing Information Widget
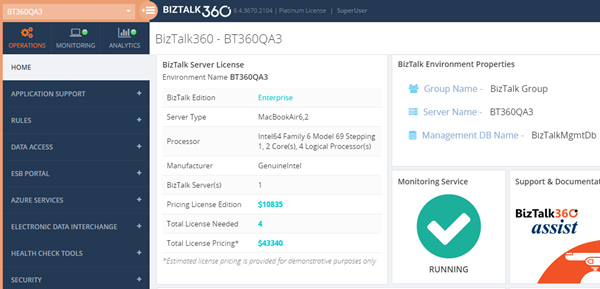
We added a new widget on the Home Dashboard screen that will display key information of the BizTalk server such as BizTalk edition, Server type, Processor, Manufacturer, Number of BizTalk Servers, Total number of license needed and estimated pricing.
For more details about BizTalk Server Licensing, please refer this
blog article.
9. BizTalk Health Monitor Integration
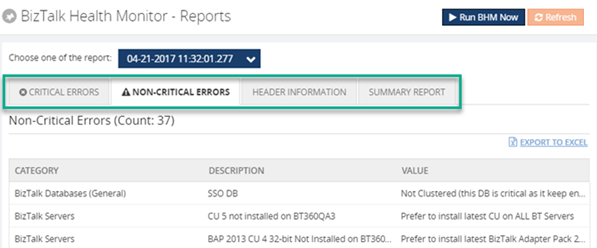
BizTalk360 now supports BizTalk Health Monitor (BHM), previously known as Message Box Viewer (MBV). For many years, we had support for Message Box Viewer where we periodically run MBV in configured environments, parse and store the result and display it in the BizTalk360 web console.
10. BizTalk Server Host Throttling Monitoring & Availability Monitoring
The ability to monitor throttling is not something new in BizTalk360. With
Throttling Analyser, you can easily identify when your BizTalk environment is throttling and in what particular state. With the new host throttling capability, you can visualize and get alerted whenever your BizTalk environment is in the throttling state.
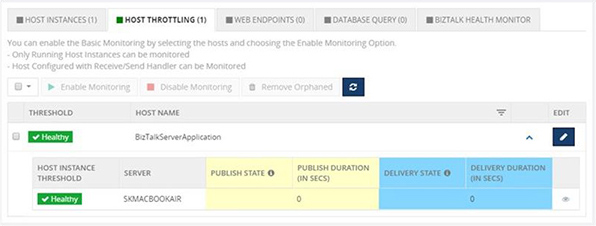
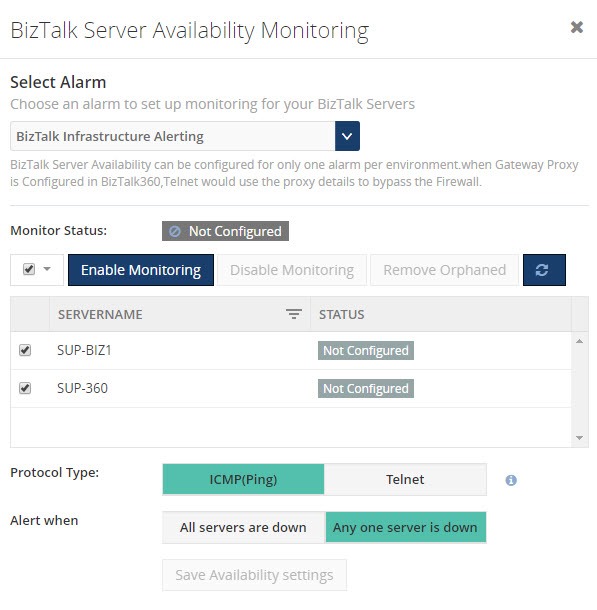
In addition to host throttling monitoring, we also added the capability to monitor the availability of your BizTalk server, say, all your BizTalk servers are up and running. If something goes wrong with one of your BizTalk server, you will automatically get notified about this through the notification channel.

11. Email Template
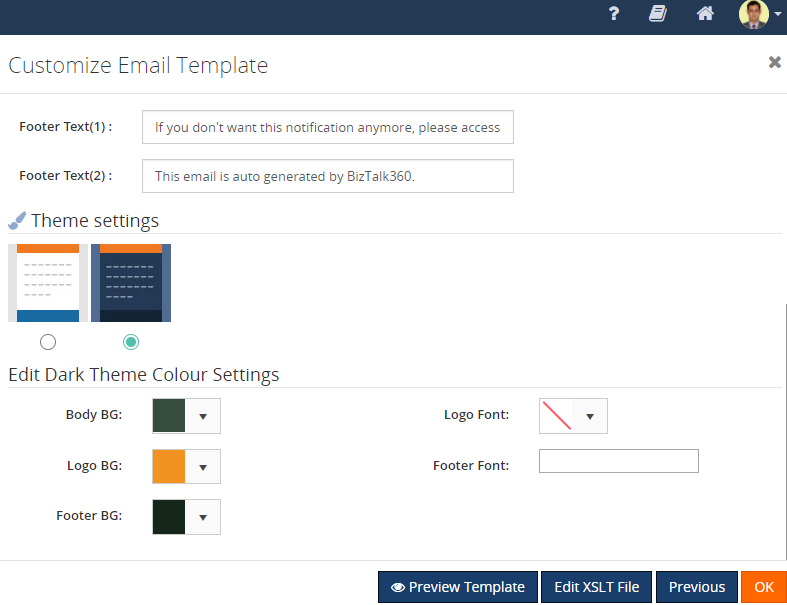
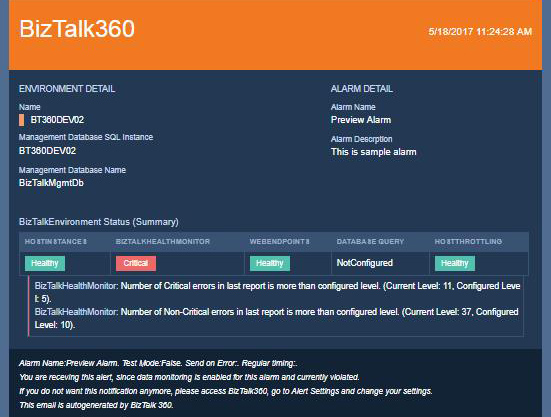
You can now set up different email templates for different alarms — customize the colour of the email body, font, logo, background, footer background etc. You also have the option to create an email template with an in-built XSLT validator with preview options. We have provided an option for you to choose the notification template in a light/dark theme.


12. Azure Integration Account
In an effort to support Hybrid Integration, we have
integrated Azure Integration Account within BizTalk360. This allows users to access Maps, Schemas, Certificates, Parties and Agreements stored in Azure Integration account in configured Azure subscriptions all withing BizTalk360 instead of logging into the Azure portal.
13. BizTalk Reports (Analytics)
We added this new feature “
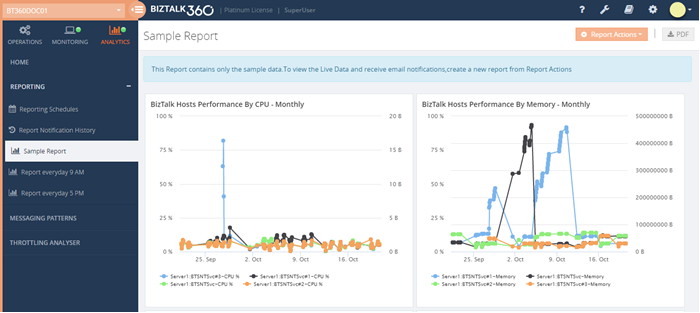
BizTalk Reports” under Analytics that offers capabilities for users to create schedules and generate PDF reports of performance metrics at specific time intervals (eg., daily/weekly/monthly). The PDF will contain the key performance metrics of BizTalk, SQL and IIS servers, messaging performance and so on.

14. Event Log Data Monitoring
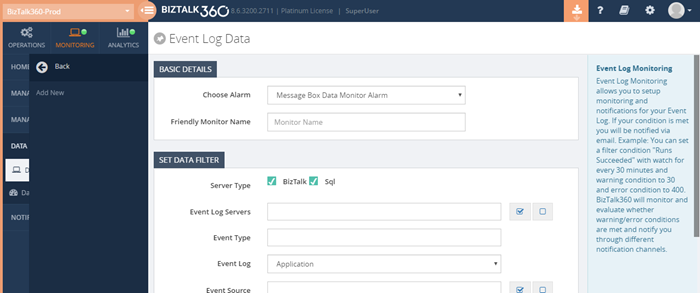
In addition to the existing data monitoring configurations, users can now monitor the event logs from BizTalk and SQL server in a particular environment. Users can take advantage of the rich querying capabilities of BizTalk360 Data Monitoring to monitor the event sources from different servers in a single place.

15. BAM Related Activities and Documents
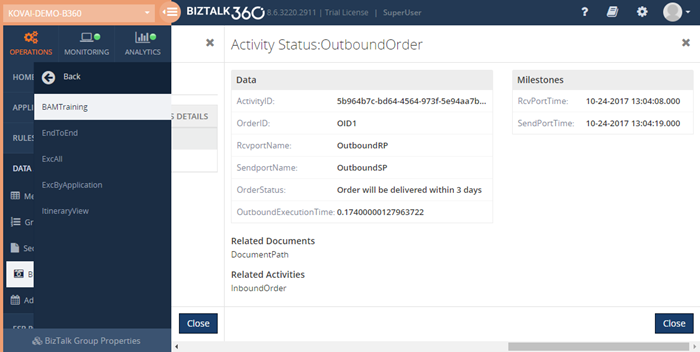
We enhanced the existing Business Activity Monitoring (BAM) feature to accommodate the Related Activities and Related Documents functionality similar to BAM portal. We brought in this feature due to the repeated requests from our customers. You can view the detailed information for the request, view the related activities for the request, download the related documents and view the response activity.





 Additionally, users can now connect a Microsoft Teams channel to their respective BizTalk360 alarms with the proper Webhook URL and receive alert notifications directly to their Teams channel.

 In addition to Logic App Operational capabilities, users can configure Data monitoring to monitor and trigger alerts based on historical events.


 Similar to Folder monitoring, BizTalk360 also supports the monitoring of FTP, FTPS and SFTP adapters. The main purpose of configuring monitoring of these adapters is to monitor for data pile up!


 For more details about BizTalk Server Licensing, please refer this blog article.

 In addition to host throttling monitoring, we also added the capability to monitor the availability of your BizTalk server, say, all your BizTalk servers are up and running. If something goes wrong with one of your BizTalk server, you will automatically get notified about this through the notification channel.
