
Praveena
Author
Published on : Jun 21, 2022
Category : BizTalk Server
As many of you might already know BizTalk360 comes with a new release every quarter with a bunch of new features and enhancements. The features are taken up based on the feedback and suggestions that we receive from the customers. It’s now time for the release of BizTalk360 v10.3. This blog explains one of the enhancements done to the Analytics reporting section.
Analytics Reporting is a widely used feature in BizTalk360 where the users can get an overview of the performance-related details of their BizTalk and SQL servers in the mail in the scheduled time. Reporting helps companies to monitor their business and be alerted when data falls outside of expected ranges. Reporting is the act of translating raw data into information. This raw data can come from a multitude of data sources such as a production database, an operational database like MySQL, Google Analytics, and a CRM system like Salesforce.
While the reporting that comes out of these databases are useful, they’re often standardized and summarized versions of raw data. This might be enough information for your business, but to get the most out of your data—you need analytics. In the case of BizTalk Server, your day-to-day monitoring analytics may cover various aspects of performance like BizTalk Servers performance, CPU performance, etc.
BizTalk360 offers out-of-the-box capabilities that provide a graphical display of the key performance metrics of the BizTalk Server. In any business environment, these metrics will be of critical importance for the management to take business decisions. BizTalk360 provides the option for users to generate PDF documents of critical performance metrics at specific time periods depending on the requirement.
In the previous versions, there would be different places to configure the reporting schedules and then the reports. This would be a cumbersome job for the users to move between the different options and the screens. This may lead to some confusion or configuration missing which may result in the functionality not working as expected.
To overcome this challenge, in BizTalk360 v10, the configurations were brought into one single place, where the users can configure the schedule and the reports together in one place. This helped the users a lot since all the configurations were done in a single place.
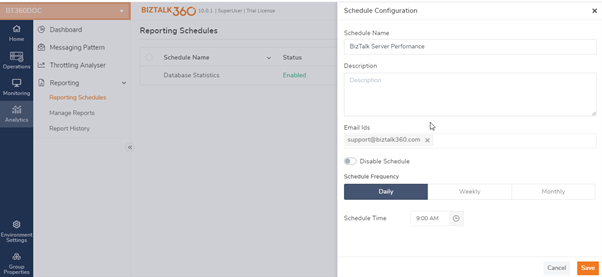
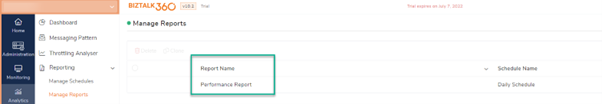
Even though the schedule configuration is done here, the user has to move to the next option to configure the reports by adding the corresponding widgets for which they want to view the data in the pdf. This was done in the Manage Reports section.
The Analytics dashboard contains the widgets which provide a clear visualization of the performance and tacking data in a nice graphical way. So, in order to get these details in the email, these widgets must be added to the reports so that the data can be captured, and an email sent during the scheduled time. Again, here is the duplication of the widgets since they occur in two places, the Analytics dashboard and in the Reporting section which may lead to overhead.
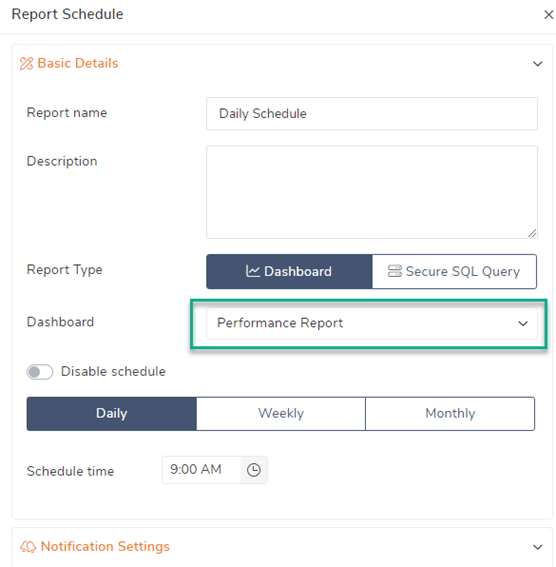
BizTalk360 aims in developing features that are always very user-friendly and easy to use. Again, this is done with the help of the suggestions and feedback we receive from the customers. In this latest version of BizTalk360 v10.3, the configuration is made much simpler, where the widget’s configuration in the reports can be done in the same place where the schedules are configured.
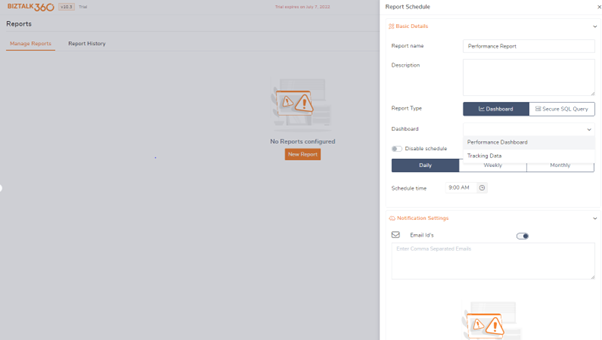
The dashboards that get listed in the dropdown are the ones that the user creates apart from the default dashboard available in BizTalk360. The dashboards must be created as the global dashboards to be listed in the drop-down in the report’s configuration. The pdf would be generated based on the widgets that have been added to the dashboard.
In many organizations, not all users will be given database access. Hence to run specific queries and view their results, the Secure SQL Queries section was introduced in BizTalk360. There was a requirement that the query results needed to be sent in the mail so that the users can get a clear view of the data during that time. But there was a difficulty in viewing the complete result of the query in the pdf where only the partial data was captured.
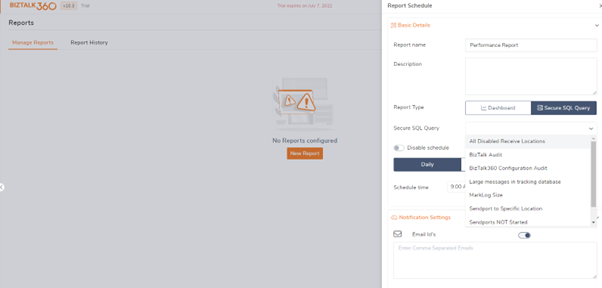
Now the SQL query widget is added as a separate section where the users can select the queries from the down. The list contains the queries that are available in the Secure SQL queries of the Administration section. All the custom queries saved by the users will also get listed in the dropdown. The query results will be sent as an attached excel instead of pdf so that the complete result is visible. This way the user can get a complete view of the query result.
This integration of the reports with the Analytics dashboard reduces the overhead of the user and makes the reporting process much easier and simpler thus avoiding multiple switching. One of the pain points in the SQL query widget was the option to view the complete result which has now been overcome by this integration.
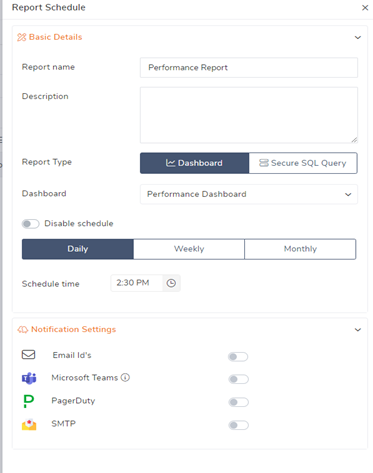
Apart from the emails, now the reports can be triggered to the notification channels as well like the email alerts. The configured notification channels would get listed and the users can either provide the email id or enable the required notification channel to which the reports need to be sent. The reports can be published on the following notification channels.
Also, apart from the default widgets in the Analytics dashboard, there are a few widgets that have been merged into the Analytics Dashboard like the IIS Server Performance, Monitoring – Event log Data Count and the MessageBox KPI widgets which were available in the reports section in the previous versions. This will help the users to view the data of the additional performance widgets in the dashboard and also add them to the reporting.
In the analytics section which deals with the performance and tracking of related data, it is important that the features must be user-friendly and easy to use so that the details are clearly visible to the users and easily accessible. This way they can make the most of the feature.
It would be curious to know what will happen to the reports that are configured in the previous version when it is migrated to the new version. Let’s check that. Consider a scenario where the user has configured a daily schedule with the performance report adding the performance widgets to the report. Now after the migration, the schedule would remain the same, but the performance report would get created as a global dashboard and would get listed in the reports’ configuration so that no data would be lost.
BizTalk360 v10.3 is coming up with a lot of new features and enhancements. Why not give a try to effectively monitor and manage your BizTalk environment. Getting the overview of the Analytics data will give a better understanding of the performance and tracking of related data and take the necessary corrective actions accordingly. Integrating reports with the dashboard will ease the users to get the list of the available widgets and get their details easily in the report mails.
Un casino en ligne France légal est la meilleure option pour ceux qui veulent éviter les problèmes liés aux casinos illégaux.
Populära casino utan svensk licens ger mer kontroll över spelupplevelsen.
Slottica obsługuje wiele metod płatności, w tym lokalne.
Mobil telefoningizda o’ynashni boshlash uchun Mostbet UZ saytida ro’yxatdan o’ting.