
We are pleased to announce the release of BizTalk360 version 10.7, which includes several improvements to the monitoring section and new features that add more desirability to the product.
In this blog, detailed information is provided about the features and improvements made in 10.7.
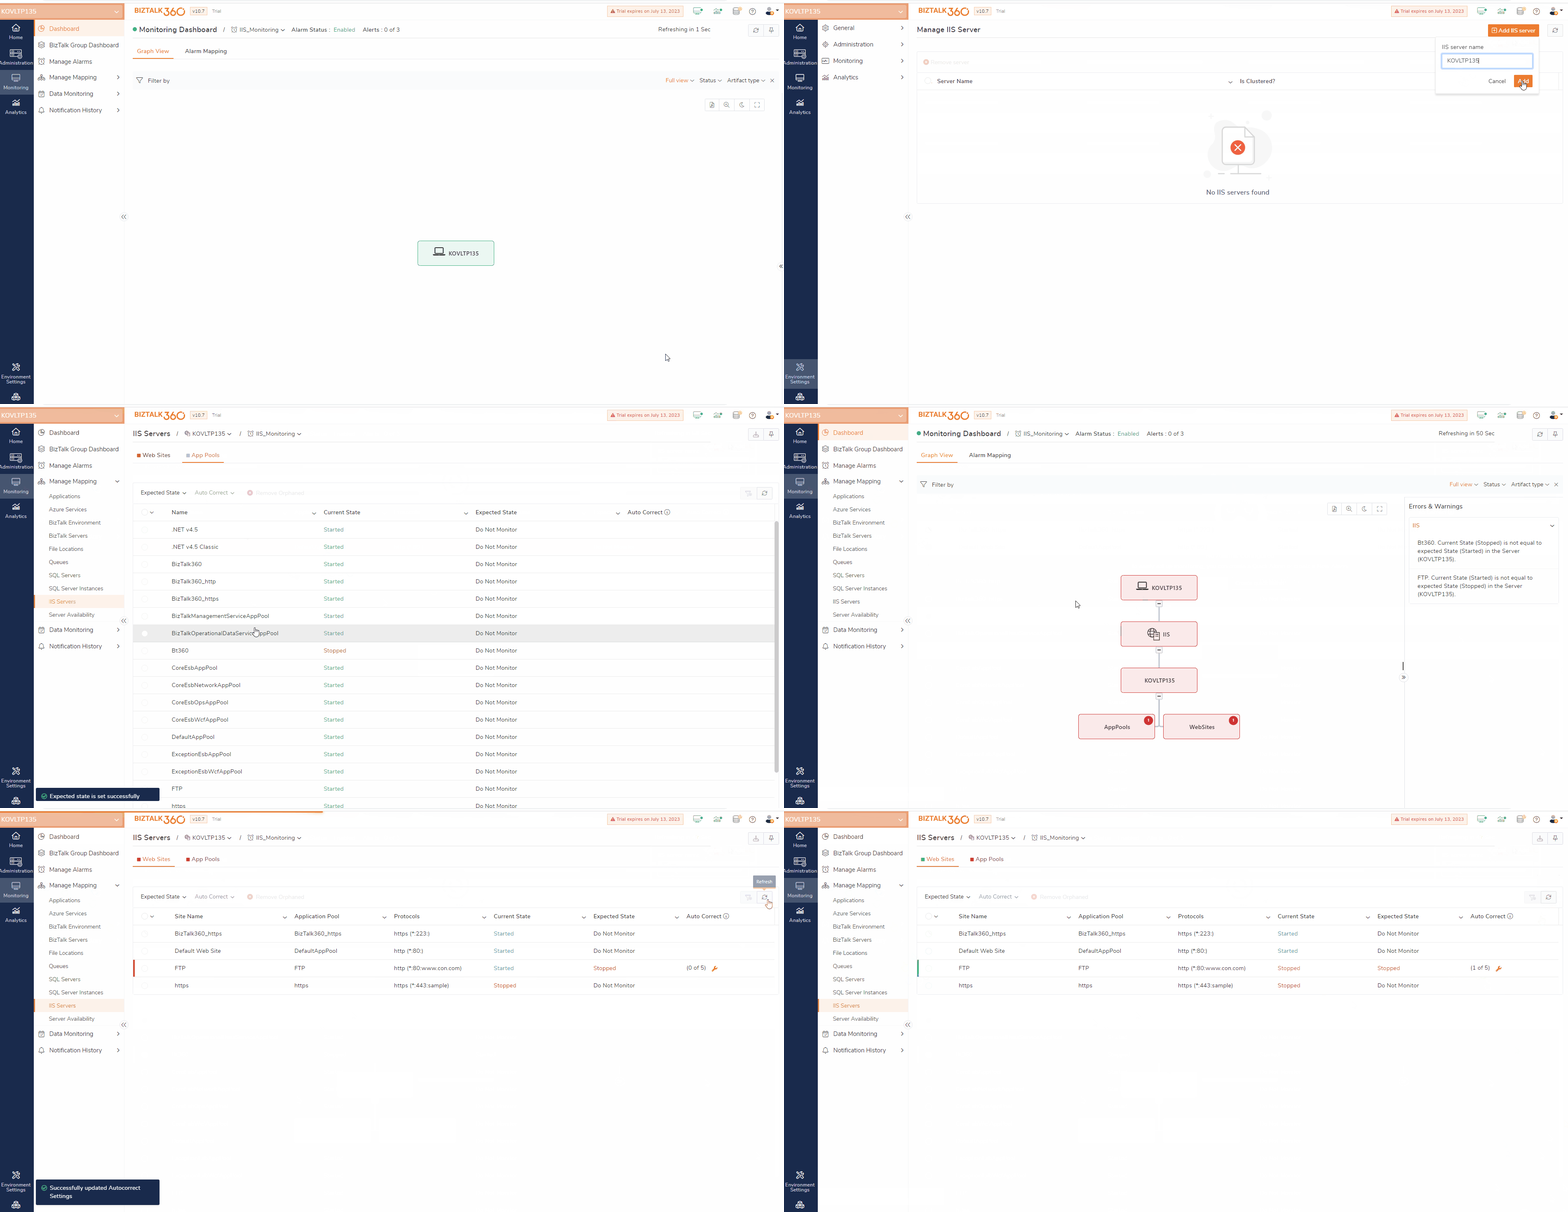
To guarantee the availability, efficiency, and security of web applications, users must keep an eye on the IIS websites and app pools. BizTalk360 helps in meeting this aid.
To monitor IIS servers, the respective server must be configured in BizTalk360. Using Telnet or Ping (ICMP), the connection between BizTalk360 and IIS servers is established. The server where the BizTalk360 setup is available must thus have Telnet (TCP/23) and Ping ICMP/Protocol-1 enabled.
Once the connection between IIS servers and BizTalk360 is established, they can be monitored using BizTalk360. Select a website or app pool from the list and set its expected state based on your desired monitoring criteria.
Optionally, auto-correction can also be enabled for IIS websites and app pools. Auto-Correction helps users maintain the expected state of websites and app pools without any manual interventions. Whenever an auto-correction is performed, it is logged under governance and audit.
By limiting access to authorized users, BizTalk360 makes the process of monitoring the IIS servers secure.
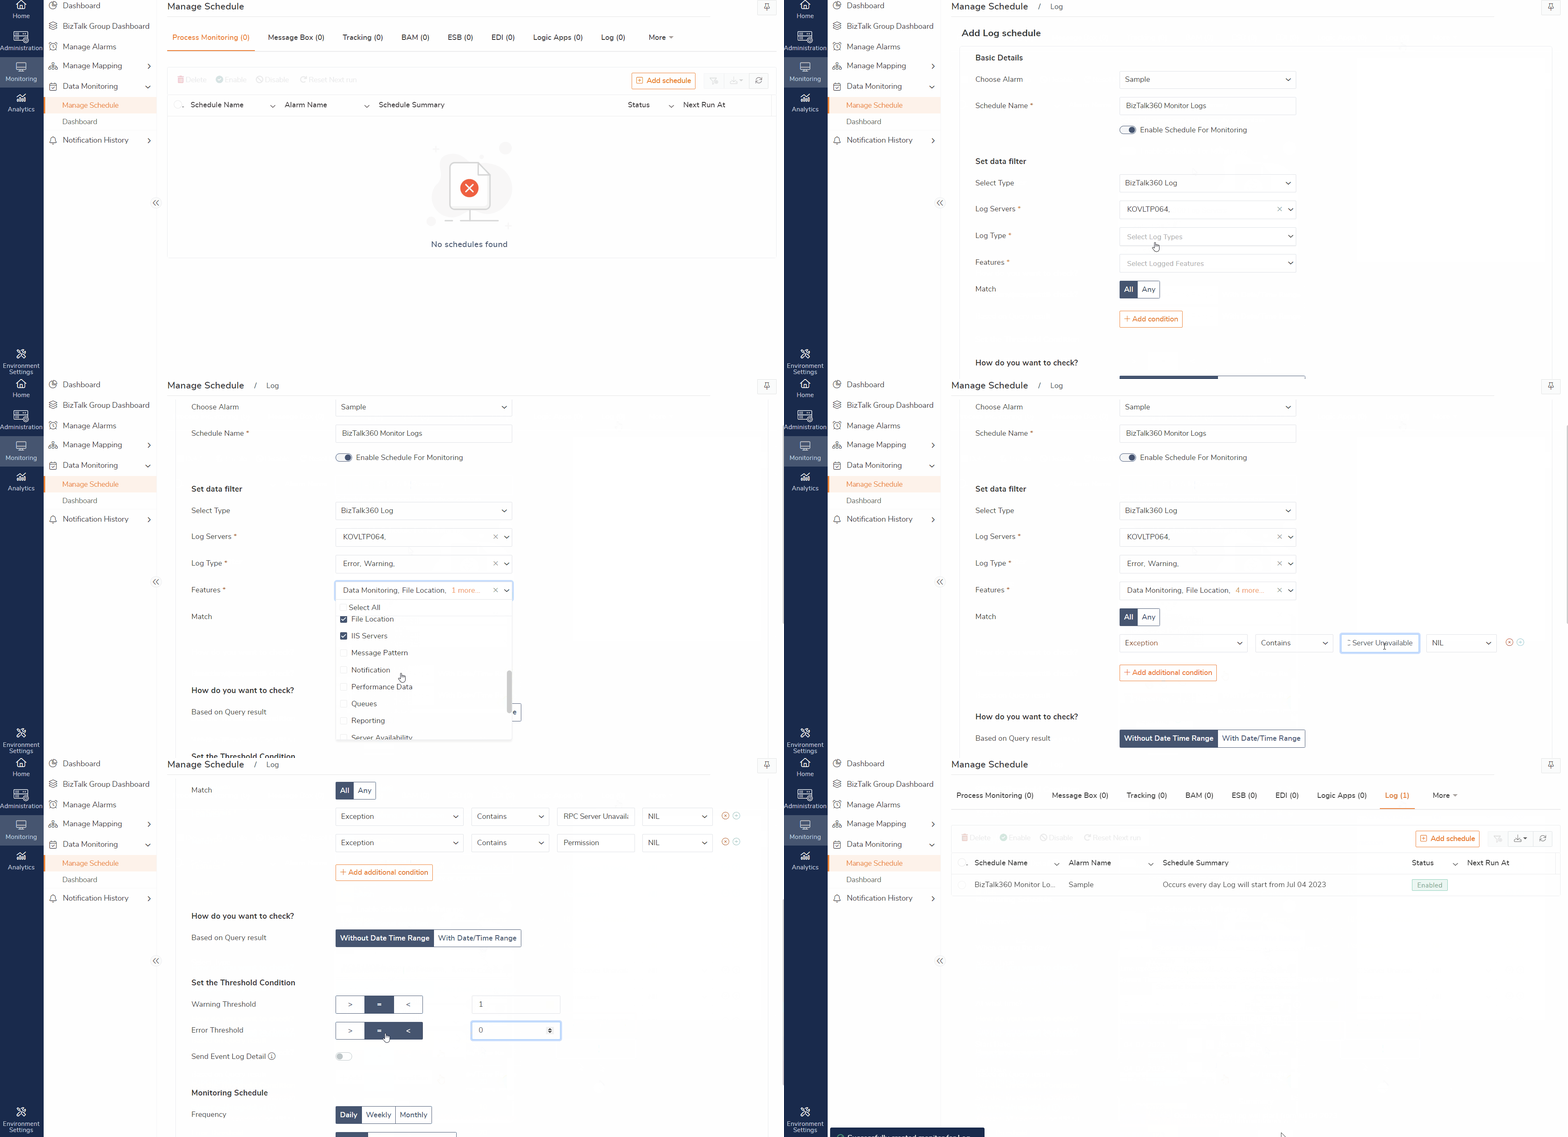
To troubleshoot any events, the error messages or exceptions play a significant role in identifying the root cause. BizTalk360 logs ease the flow of finding errors within the BizTalk360 application.
To indicate the level of logs to be collected, the configuration needs to be completed initially. Enable the desired feature lists to collect logs for the specified log levels. It would be more efficient if users were able to monitor the logs that are collected in the BizTalk360 logs.
In some scenarios, there might be a chance of facing an exception or errors due to misconfigurations of any setup in BizTalk360. This leads to exceptions in the sub-services. To identify the errors and overcome such situations, BizTalk360 log monitoring will be helpful.
The users can create BizTalk360 Log monitoring schedules by choosing the server that needs to be monitored. The users will be notified regarding the exceptions or errors found in the data monitoring results configured.
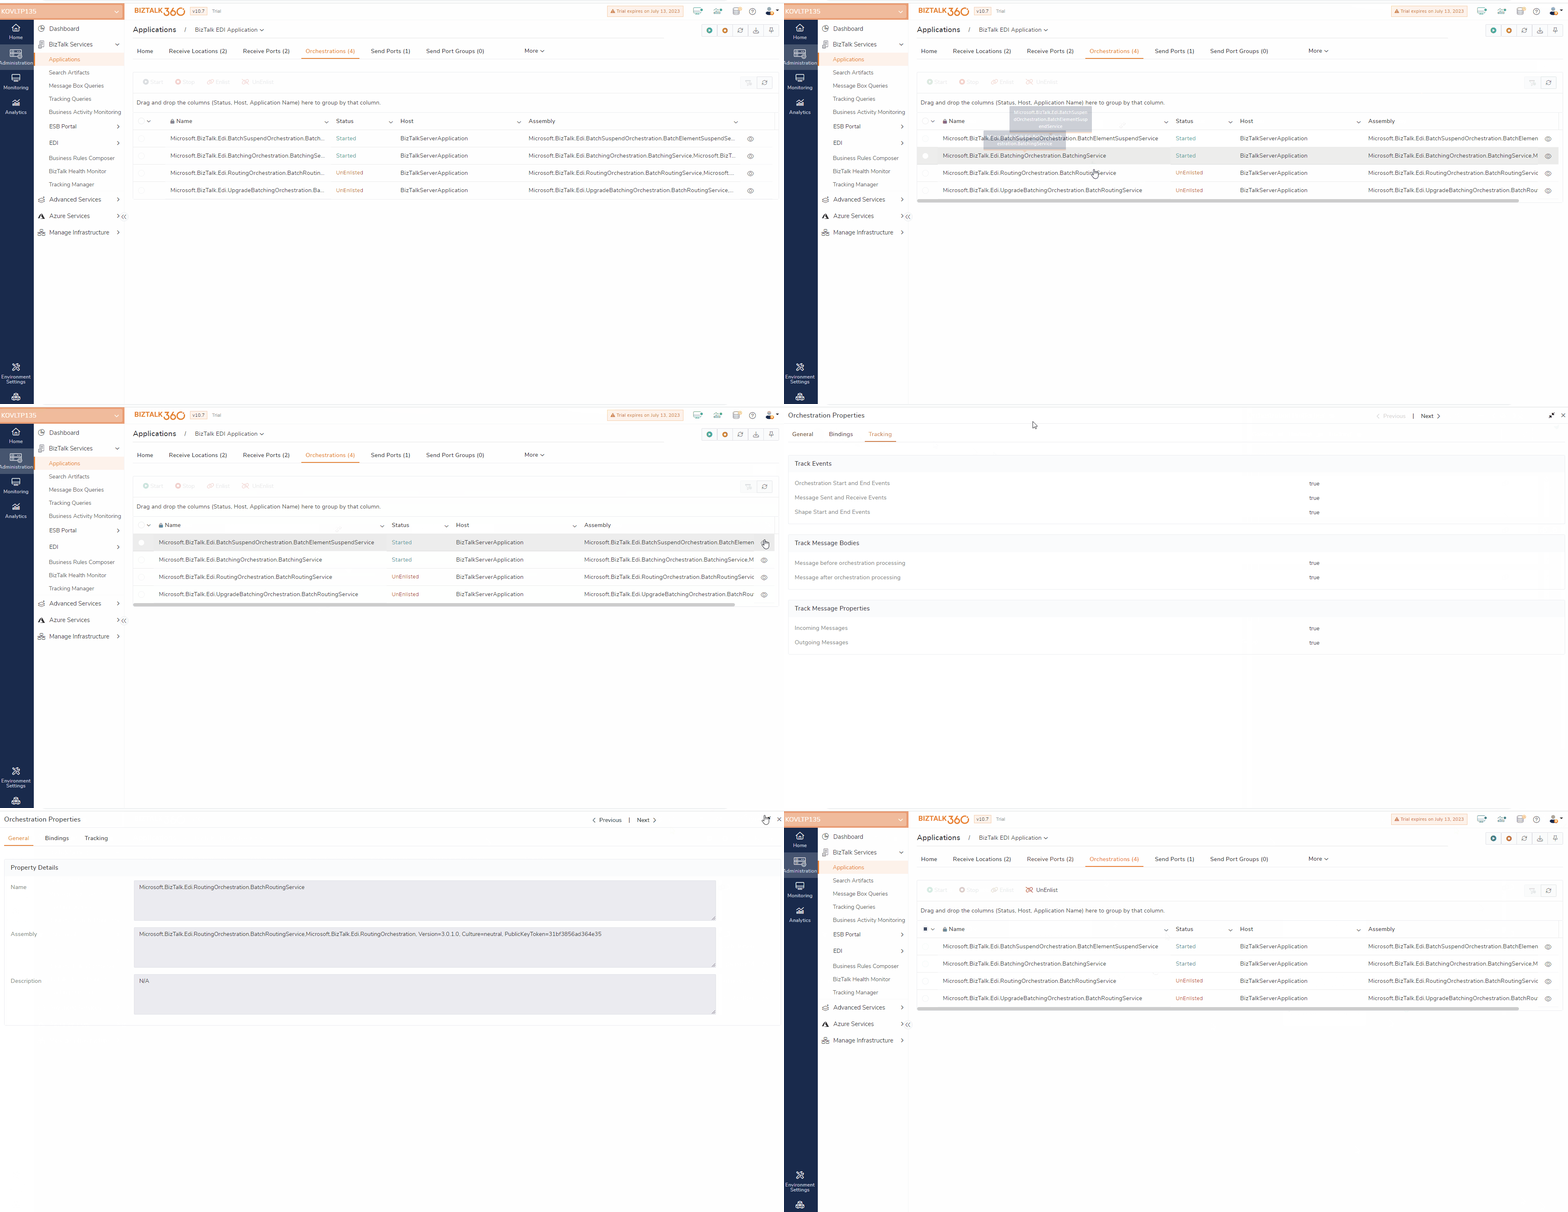
In areas that handle high-level data, customers desire some elements to be flexible and user-friendly. Consider a situation where data is shown in grids with longer column values. Every time a user wishes to examine data that has a value with a longer length, they must resize the column. These UI choices are preserved throughout the application to avoid this type of situation.
Now, any changes made by the user to a column’s size, a filter’s selection, or a state toggle are retained even after page navigation, page refreshes, and a full refresh.
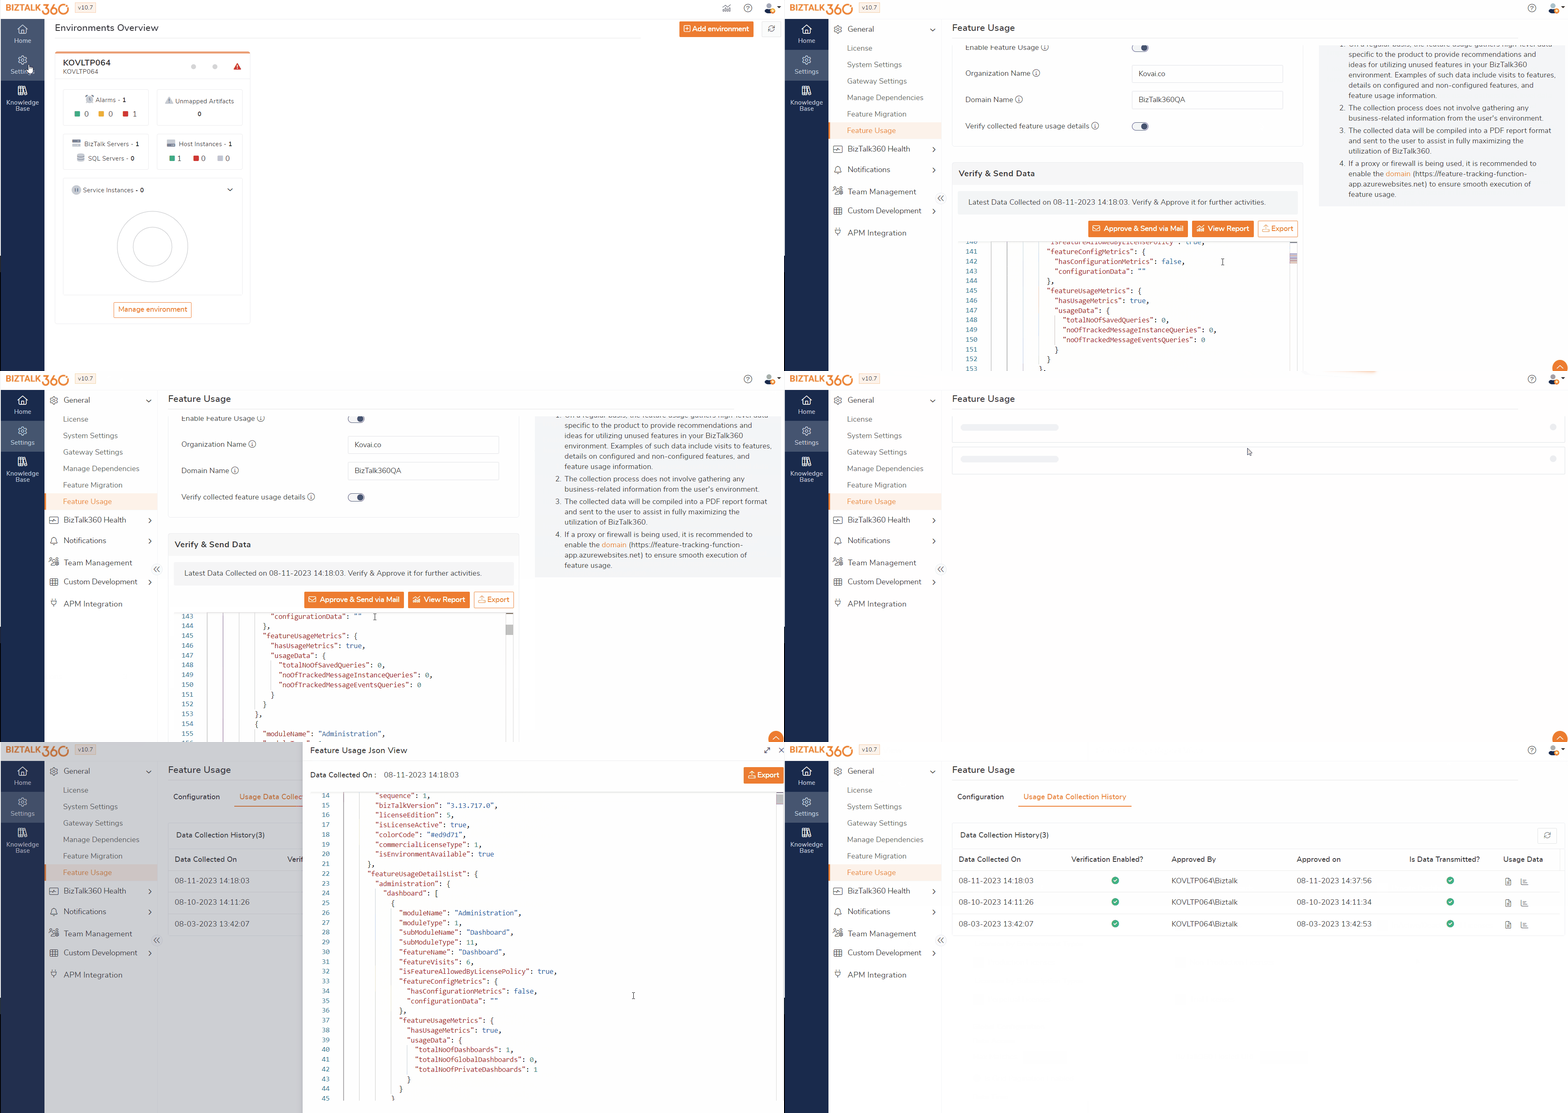
A Feature usage report is a quick catch of the features that are configured and not configured in the BizTalk360 environment. All the data, such as alarms, dashboards, users, servers configured in the environments, and the number of visits made to each module in the BizTalk360 application are collected as a report.
When you enable feature usage data collection, the BizTalk360 monitoring service may collect telemetry data from BizTalk environments. This provides insight into any missed configurations or less-used features and helps the users to make use of the less-used feature based on their business needs. This leads customers to use BizTalk360 effectively.
If the user enables the feature usage configuration, the data in their environment will be collected on a weekly basis. The usage data collection history page allows you to examine the gathered data in JSON and report format.
The Bizalk360 ESB management now allows the user to resubmit messages by entering the client credentials provided in HTTP receive locations. This assists users in preventing any anonymous message resubmissions. Whenever the user resubmits the messages, it is logged under governance and audit.
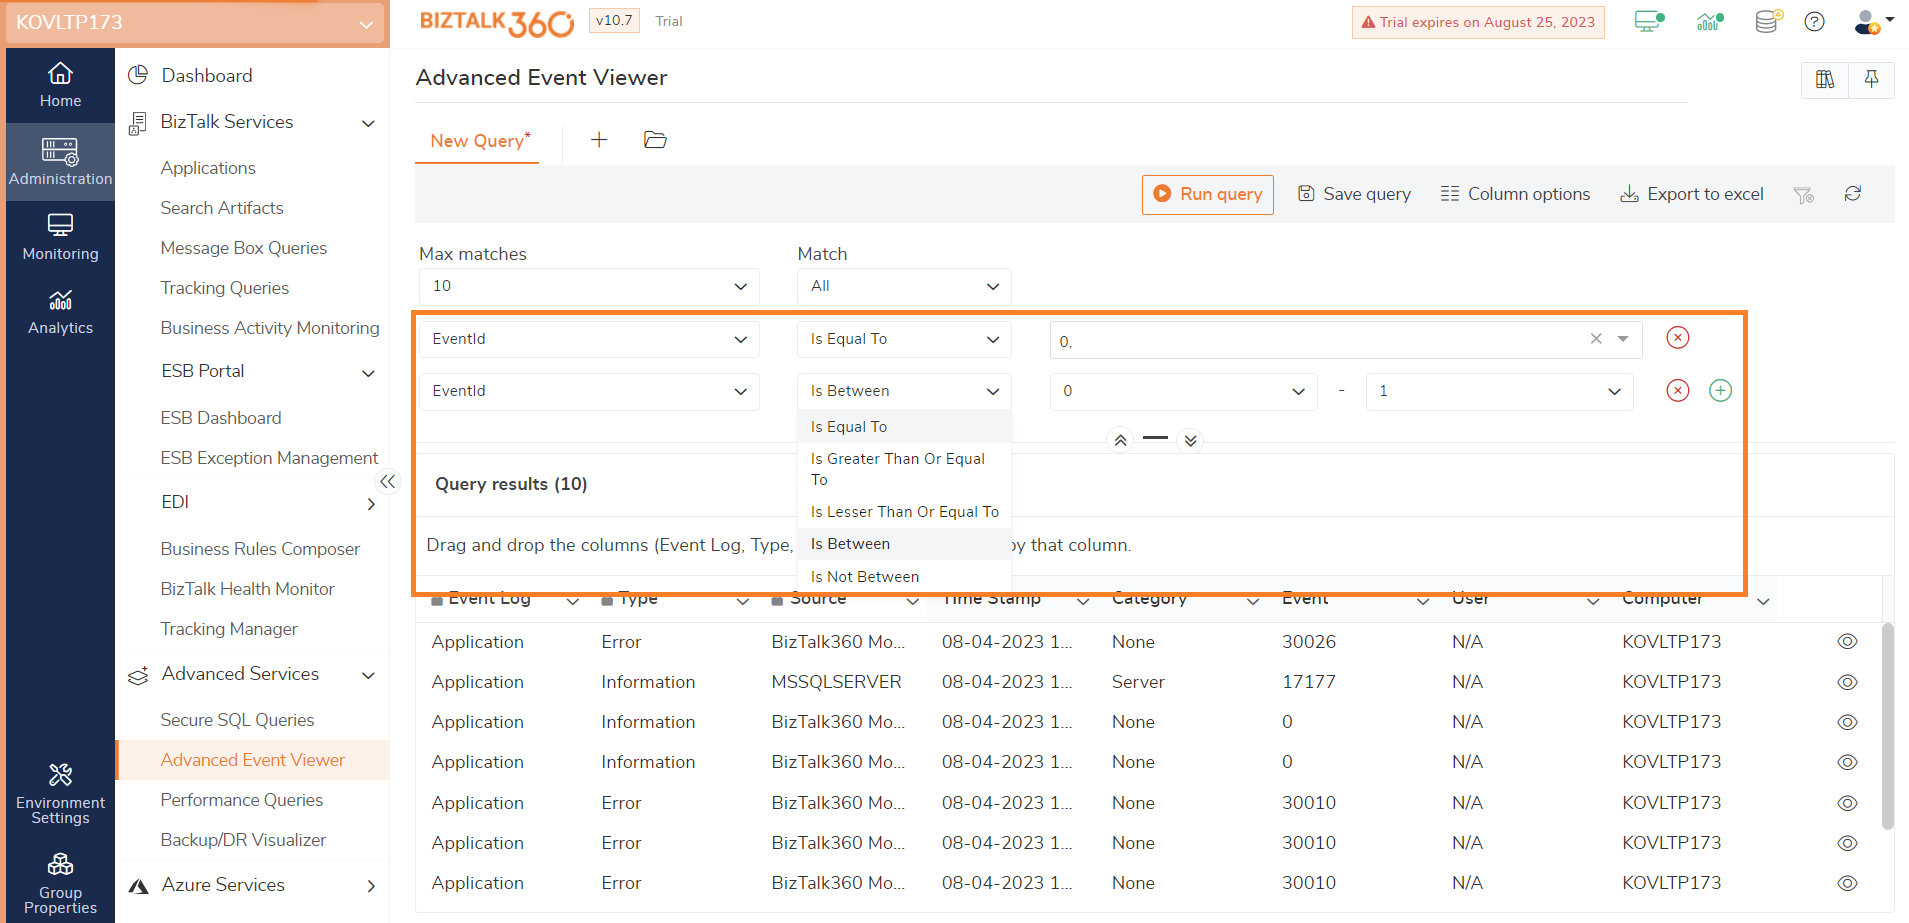
Users may apply nested filter conditions for event IDs in the Advanced Event Viewer and fault code in ESB. It increases flexibility and user experience.
Now, ‘Is Between’ and ‘Is Not Between’ conditions can be applied while adding filters. This allows users to filter event ids that fall within their expected range.
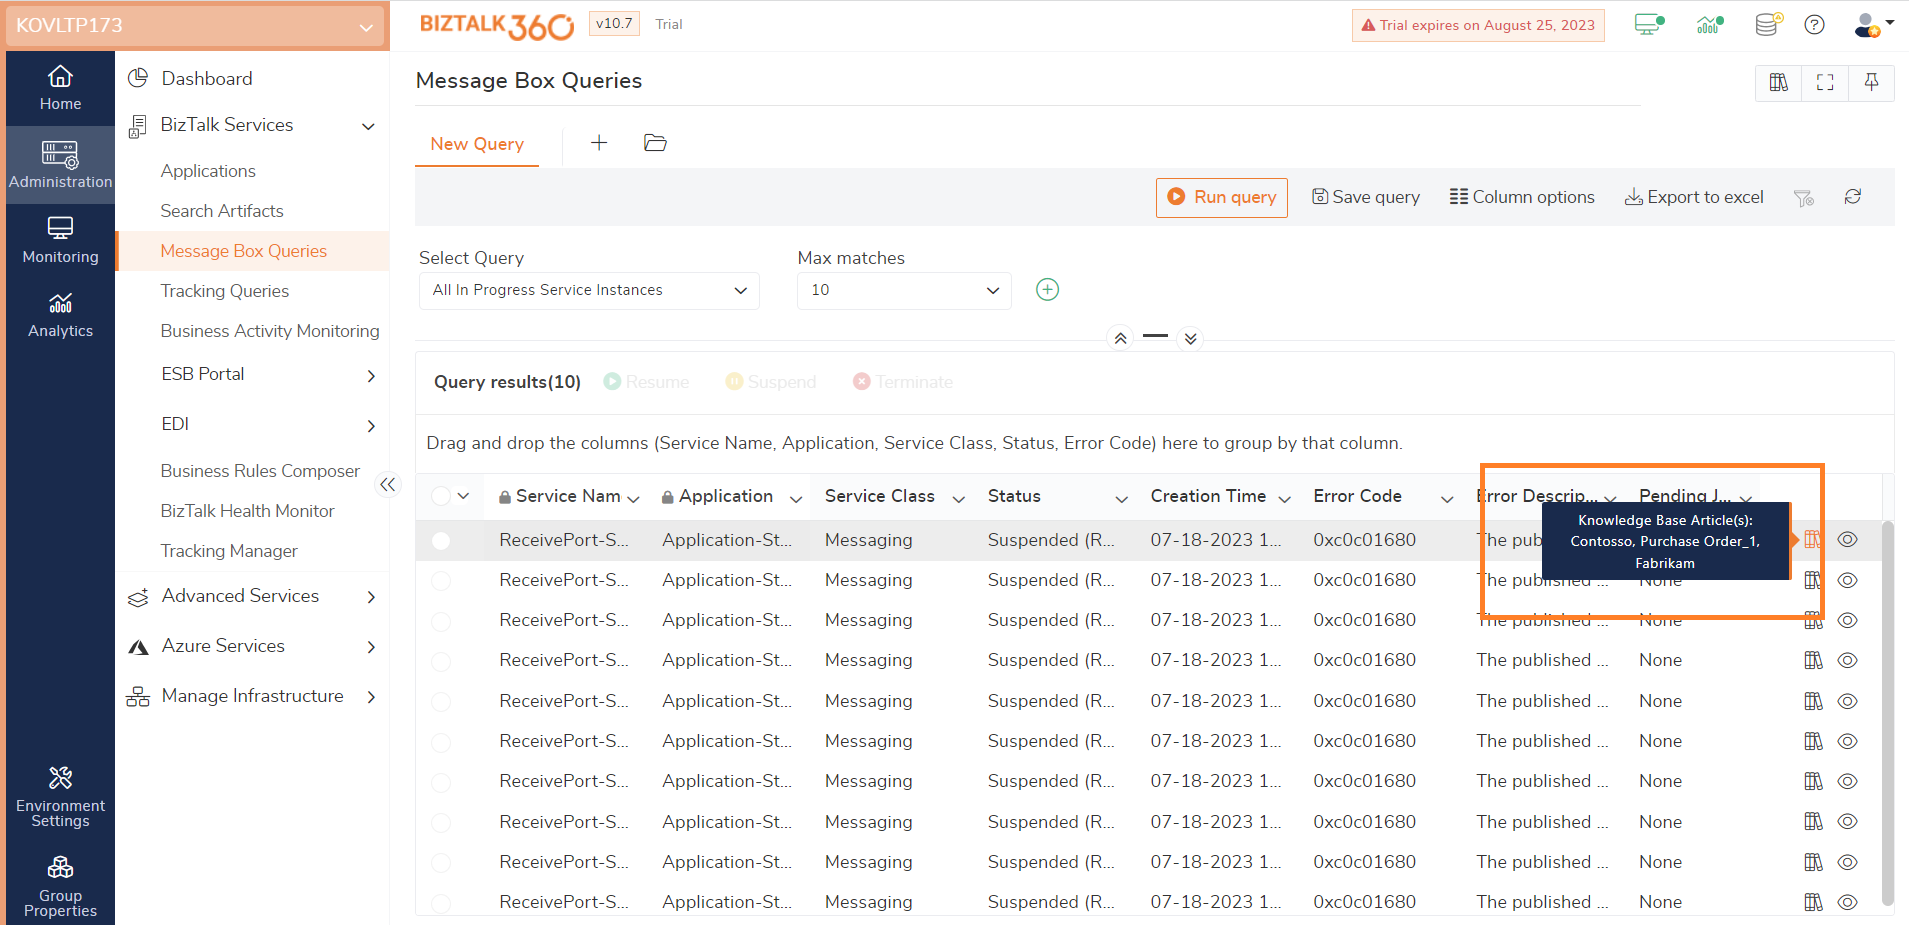
Knowledge base articles are available for Message Box Queries, ESB, and AEV. In all these areas, on hovering on the knowledge base icon in the grid, the title of the knowledge base articles available for it is shown.
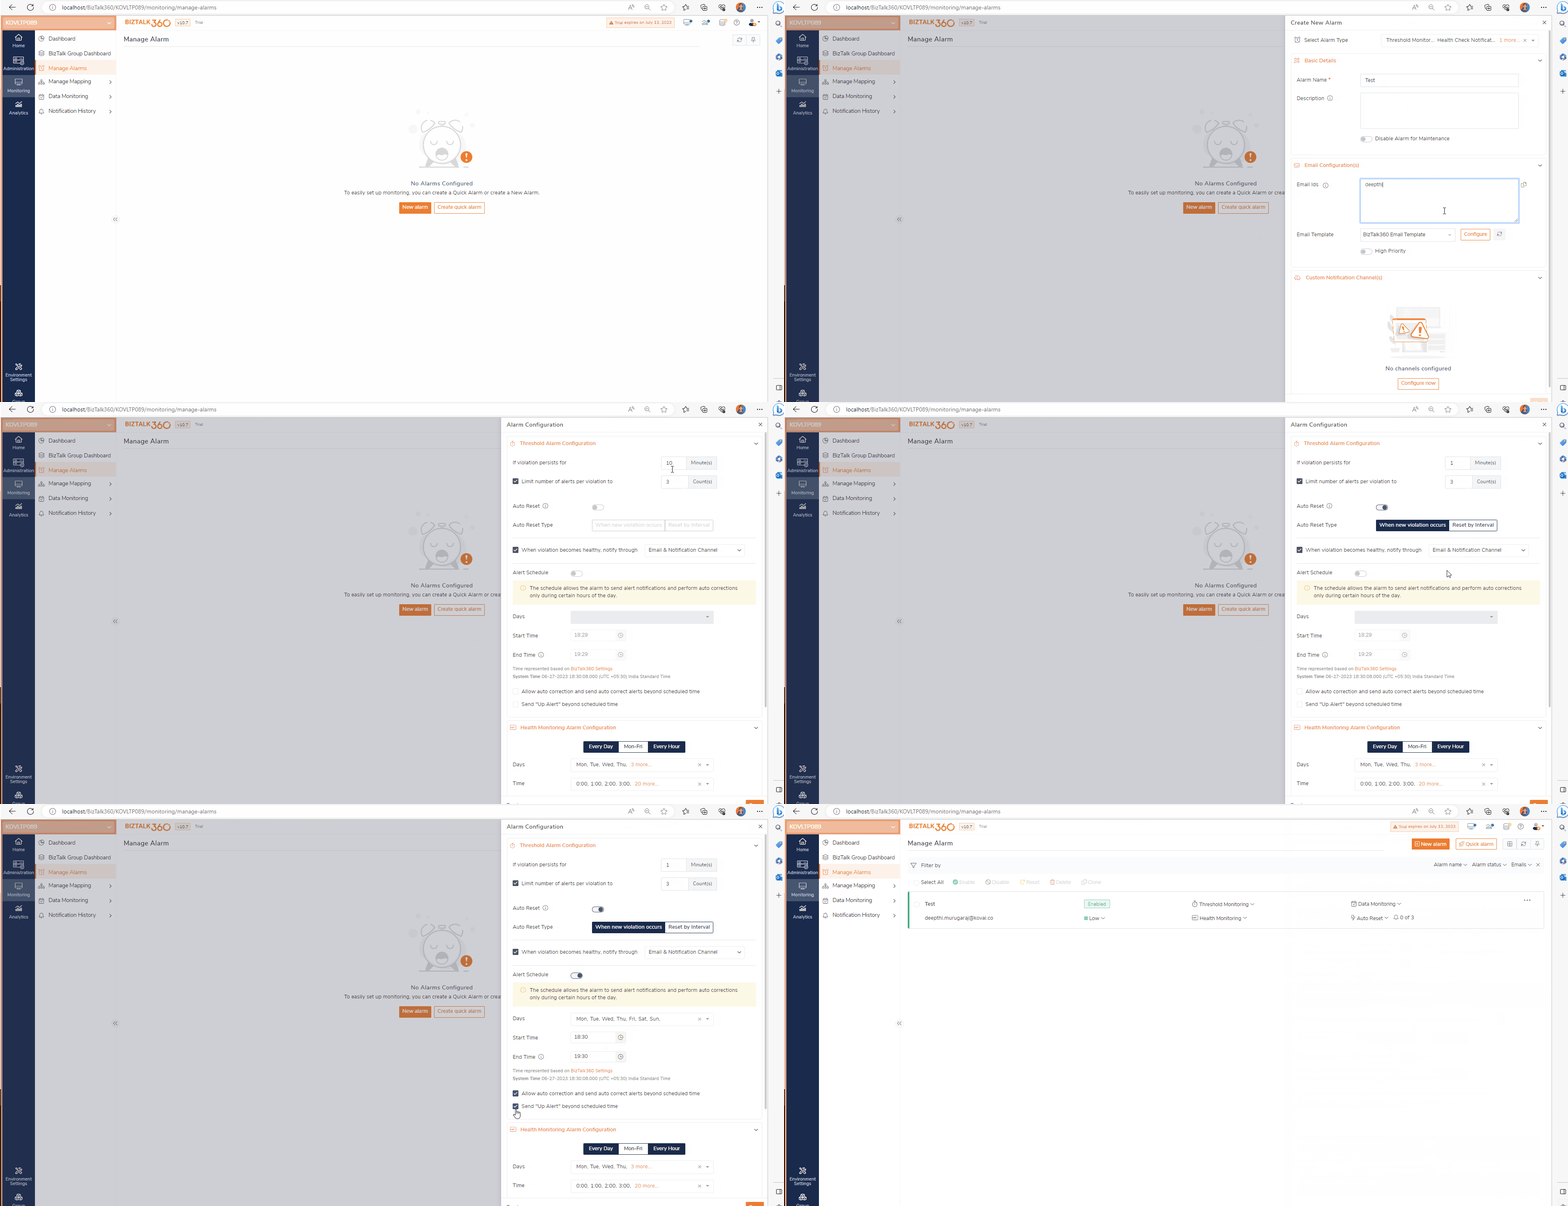
While configuring the alarms, an option to provide the frequency to perform auto-correction actions is available in the alert schedule section. Thus, the auto-correction action will be functioning only on the frequency of the date and time provided in the alert schedule section.
If a user wants to perform auto- correct action beyond the scheduled time as well, they can check the “Allow auto- correction and send alerts beyond scheduled time” checkbox option.
The configuration of alarms now has two options to reset the alarm based on the requirement of the user. The first option is the user can reset the alarm based on the “Reset by interval.” If this option is chosen, the alarm will automatically reset based on the interval that is being set during the alarm configuration.
The second option available to reset an alarm is “When a new violation occurs.” If this option is chosen, the alarms will get reset whenever a new violation is detected. And in the notification sent a “New” tag will be included in the alert for the configuration that has new violations in it.
A Down Alert is sent whenever a violation is detected. The Down Alert contains the details of the violations detected. And, when such a violation retains its state to healthy, an up alert is sent.
From now, the Up Alerts will include a list of artifacts that were down in the previous monitoring execution. It helps the users to know the violations that have been retained to a healthy state.
When the user navigates to any page in the Manage mapping area, the alarms are shown in order of the number of artifacts mapped to the alarm. Alarms with the most mappings are prioritized and listed.
This allows users to see the most important alarms depending on the number of artifacts mapped from each module. It improves the user experience and provides the ability to have a quick catch of frequently used alarms.
In Data Monitoring, whenever a schedule is created with a monthly frequency, an option called “End of Month” is available in the day of the month drop down.
Consider a management that must send the monthly report to various divisions of the organisation regarding the transactions that happened over a month at the end of each month. Data monitoring might be quite useful to handle this situation.
The users can create a schedule by choosing the time-frequency as End of Month which considers the transactions made on the complete month. Hence, management sections will receive the reports at the end of every month.
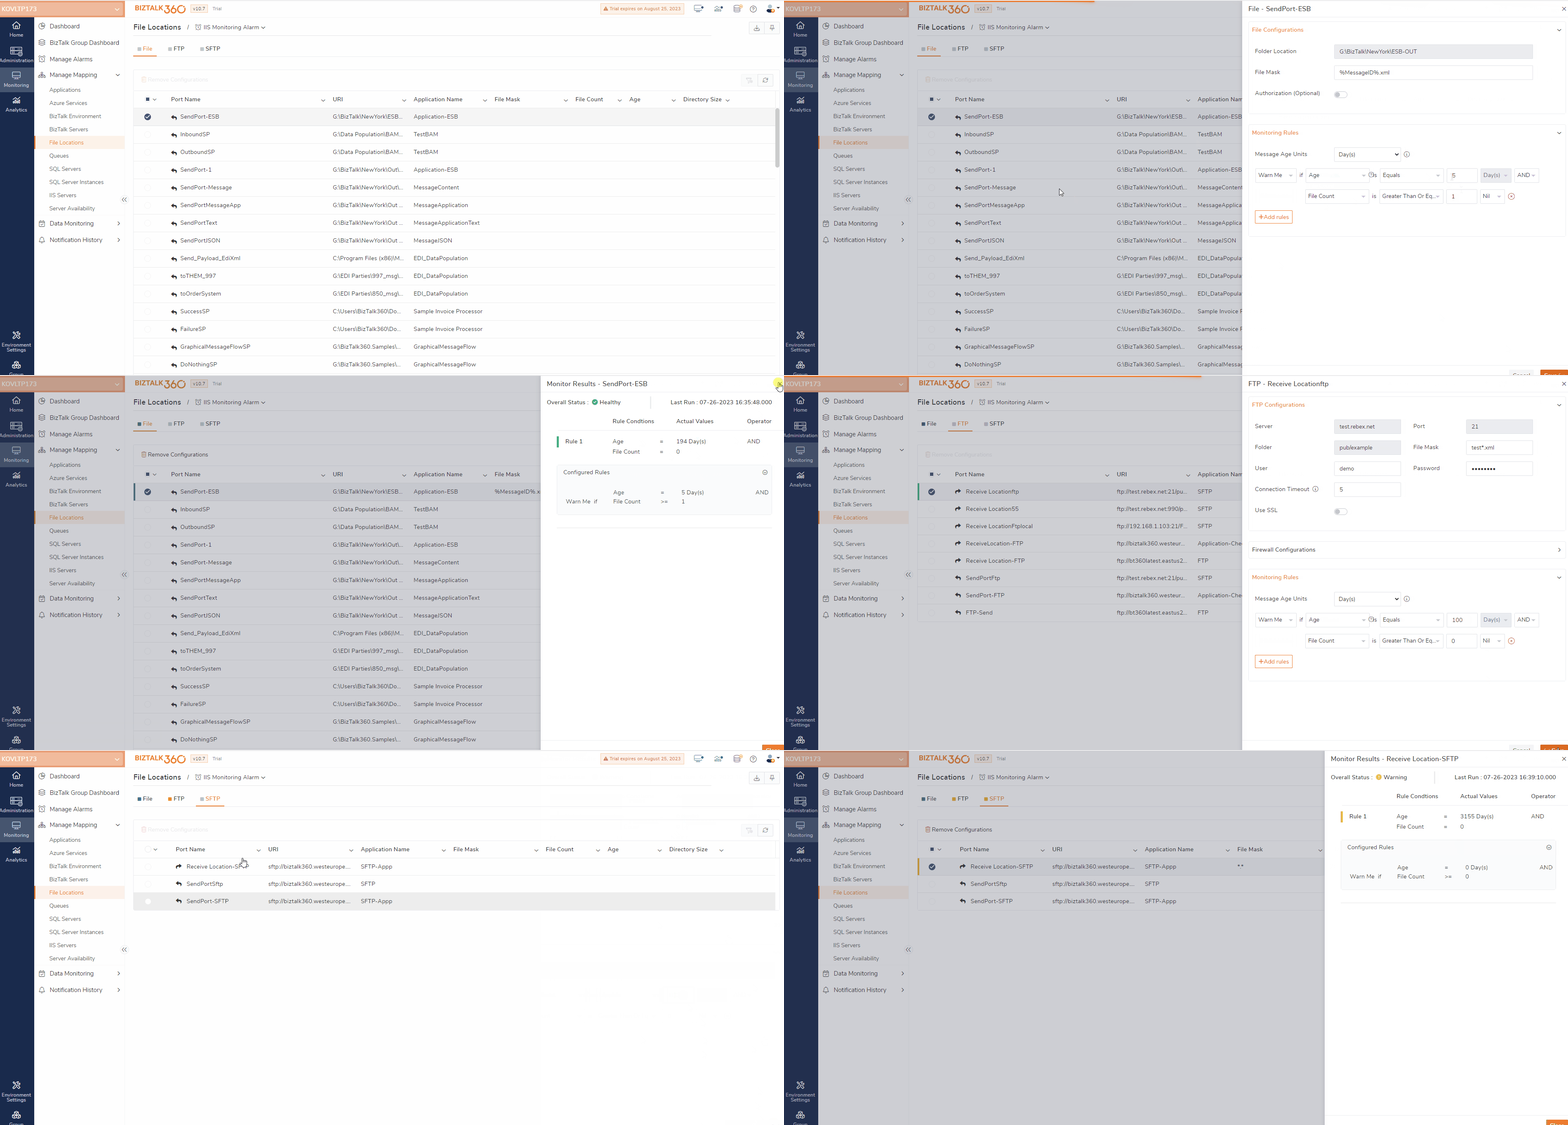
Previously, file locations (Files, FTP, and SFTP) could be monitored depending on the number of files and the size of the directory. File locations may now be monitored based on their age as well. While the age condition is selected while setting a monitor rule, the file condition also gets added.
Assume a scenario, where several files got stuck in a receive location that is been created today. If the age is provided as 1 day and the file count greater than 0, the threshold values get violated. By looking at the configuration getting violated, the users can know that files are stuck in the receive locations.
When the threshold condition meets the criteria and gets violated, BizTalk360 sends an error/warning alert with file location data to the mapped email addresses. Users/businesspeople can intimate a technical person immediately for further action.
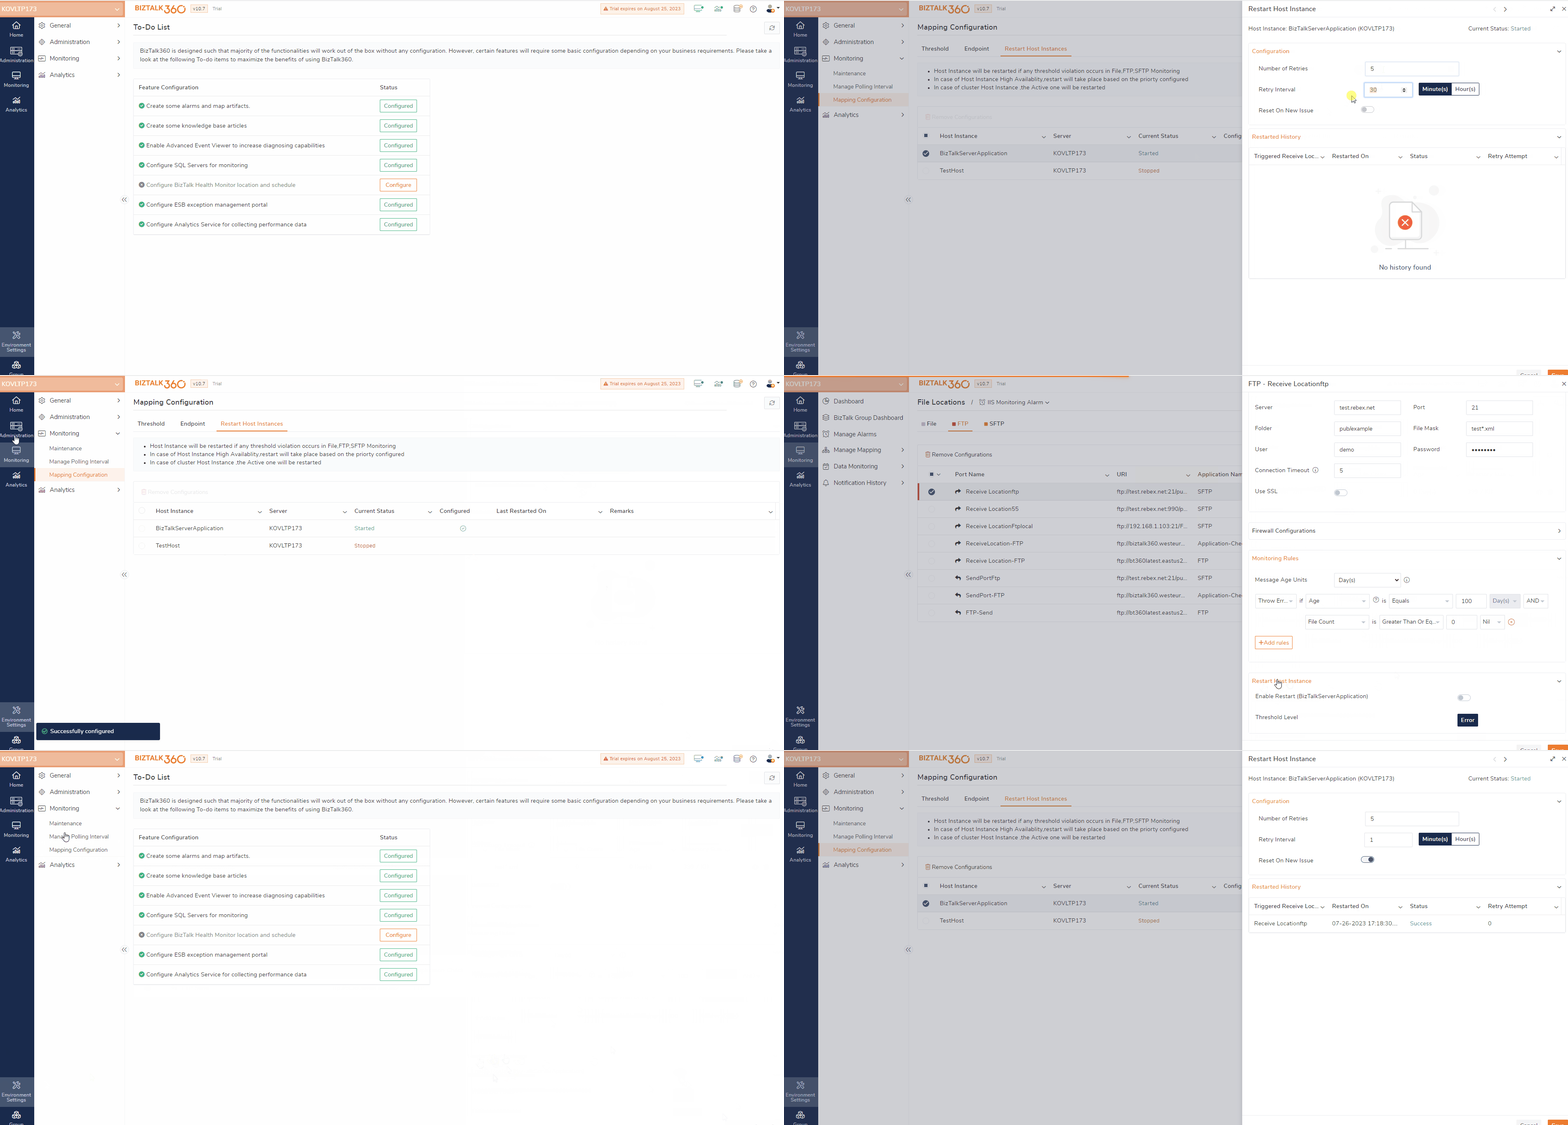
A new option to enable the automatic restart of host instances is brought in while monitoring the receive locations in File locations (Files, FTP, SFTP) monitoring. At times, files get stuck in the receive locations and remain there. To recover those files, restarting host instances is automated.
Assume a scenario, where files got stuck in a receive location. To move the files from the receive location, a restart of host instances is required. Previously to restore the files users might tend to restart the host instances manually. To overcome this manual intervention, a restart of host instances is now automated.
To enable the automated action, the restart host instance configuration must be configured initially. If a receive location artefact of any file location (Files/FTP/SFTP) is mapped for monitoring and the threshold value gets violated, the host instances get restarted automatically. The files that got stuck in the receive locations will be restored.
While adding the SQL server under the environment settings, the availability of the server can be checked using Telnet if Ping is disabled.
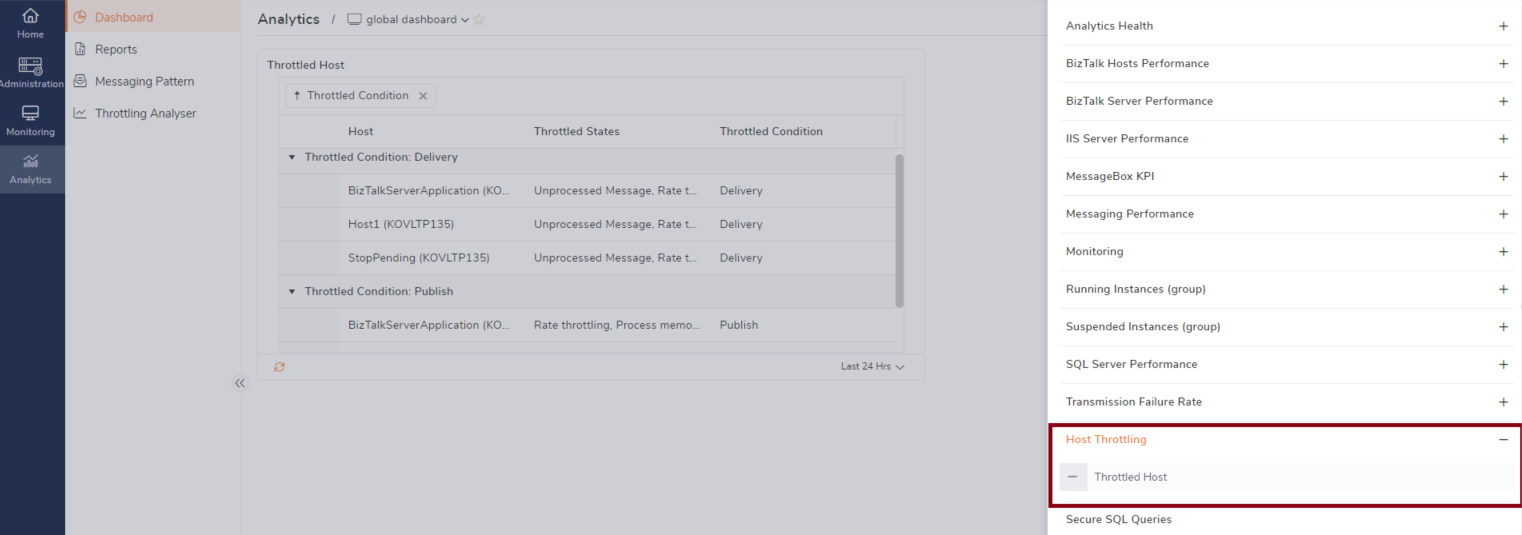
The Analytics dashboard is now updated by adding the host throttling widget. The data on publish throttling and delivery throttling can be viewed by adding the throttled host widget.
Users are provided with an option to import or export automated tasks. All types of schedules (one-time and recurrence) can be imported / exported from an environment. The automated tasks that are expired will also be imported, or exported.
While importing the automated tasks, the users are allowed to select the tasks to be imported. And the name of the tasks, email IDs, status of the tasks, destination environments, and servers can be updated.
Users are provided with the option to import or export the schedules under maintenance. The import and export of schedules under maintenance will be useful when similar schedule maintenance configurations need to be configured in the other available environments.
While importing the schedules under maintenance, the name of the schedules, destination environment, and schedule end time can be updated.
While importing any files that have mappings with servers and that servers are not available in the destination environment where you are undergoing the import process, they get orphaned. Such orphaned servers are now handled by addressing the fact that the servers are not available in the environment.
The group-by option has been implemented across the application. This has been covered in various areas such as search artifacts, ESB, BAM (Business Activity Monitoring), etc.
This helps users examine the data on grids in a finite and organized manner.
We believe that the above-mentioned new features and upgrades will enhance the user experience of BizTalk360 users tremendously.
Reach out to our team for a demo or a free trial.