
Saranya
Author
Published on : Feb 9, 2024
Category : BizTalk Server
We are happy to announce the release of BizTalk360 Version v10.9. It is packed with exciting features and enhancements. These will elevate your BizTalk monitoring and management experience.
1. RabbitMQ Monitoring
2.Azure Services Widgets
3. Notifications about Database Maintenance
4. Monitoring Improvements
5. Analytics Upgrades
RabbitMQ is a widely used message broker. It supports the Advanced Message Queuing Protocol. This facilitates communication among various systems and applications.
Monitoring RabbitMQ queues is important for real-time issue identification. It helps to identify high queue lengths, message delivery failures, and slow consumer processing. In BizTalk360, you can monitor RabbitMQ. This lets you check the queue’s status, memory, and message counts. You’ll also get notifications for any issues.
To establish a connection with RabbitMQ, BizTalk360 requires host, port, and authentication details. After successfully configuring, all the queues will be listed. You can monitor the queue by setting expected state or threshold rules for the metrics. These metrics include Memory, Total Messages, and more. System will notify you if there is any violation.
Let us take a scenario of tracking the invoice process. Two conditions govern the monitoring and notification system in this case:
View the metrics details of Azure services like Logic Apps, Azure Service Bus Queues, and Topics in the Analytics Dashboard. Get the scheduled reports.
For the Use Case (Logic Apps), configure a custom widget on your analytics dashboard. Select the Azure subscription and metric as “Runs Succeeded” . By tracking successful runs, you can see how reliable your Logic App operations are. A higher percentage indicates that many runs are finishing successfully. It aligns with the intended business logic without errors.
For the Use Case(Service Bus), Specify the Azure subscription and metric as “Successful Requests” for Service Bus topics. A high number of successful requests suggests efficient operation.
These widget details can be send as a report based on your schedule configuration.
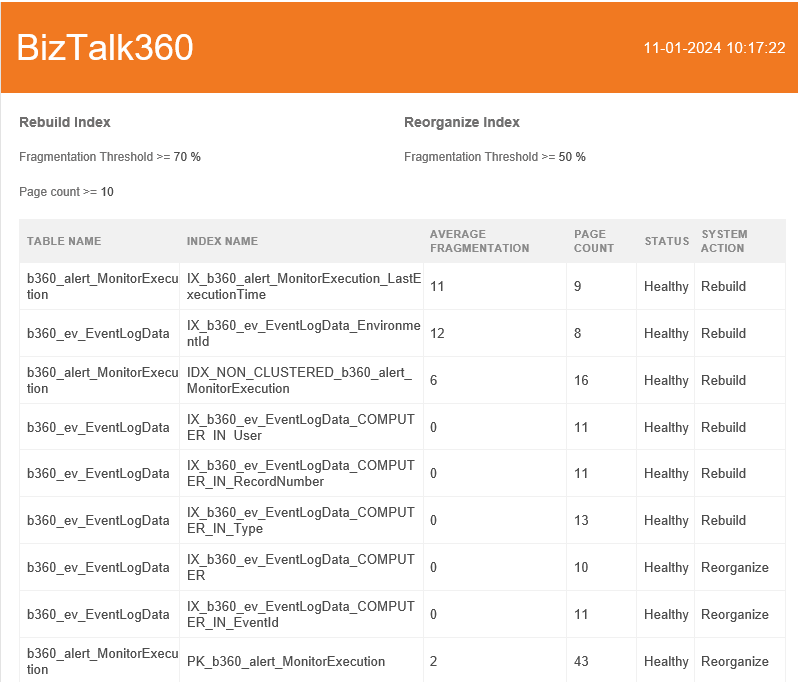
Eventually, depending on your setups, the BizTalk360 database may increase for a variety of reasons. It’s preferable to allow database maintenance to handle this.
The index will be automatically rebuild and reorganized by the system. Based on fragmentation or page count value, it makes this decision.
During database maintenance, the system will inform the admin user about the action taken.
In BizTalk360, if any artifact mapped for monitoring is removed, it will be set as orphaned.
Monitoring this orphaned artifact can result to monitoring discrepancies. So, it is always advice to remove the orphaned artifacts for seamless monitoring. This consolidated view of orphaned artifacts helps the user to view and delete them in a single place.
We introduce the export option in the Alarm mapping section. This option helps to download the alarms and all its artifacts mapping in excel format.
SQL jobs are automated tasks. They perform various functions, such as data backups, maintenance, and data processing. Monitoring SQL jobs is important. It helps maintain the health and reliability of your SQL environment.
BizTalk360 extended it support to monitor all the configured SQL Server Instances.
Add the SQL server instance under monitoring section in environment settings. If the instance is reachable then system will list all the jobs running under the instance. You can simply monitor those jobs by setting the expected state. and get notified in case of any violation.
An Option is introduced to set AutoCorrect attempts in a centralized location. The value updated here will reflect for all the artifacts.
The system now includes an option to set error and warning threshold limits for service instance monitoring in one place.
Get the priority email based to the monitoring status Healthy, Warning, or Critical. This ensures that crucial issues are addressed first.
The Analytics reports contain BizTalk performance which includes resource usage metrics, Message processing rates ,etc.
The generated analytics reports can now be saved locally for further use. They can be used by administrators for long-term performance metric analysis and pattern analysis.
Thank you! We will continue to provide more useful features!