Published on : May 13, 2014
Category : BizTalk360 Update
In this article, I’ll take you through the different performance improvements that have gone into
BizTalk360 Version 7.2. One of the key factors behind the success of any web application is the performance. Your application can have the best, out-of-the-box features that your users desire. But what’s the point when it fails to serve a request quickly! Performance troubles can happen due to various reasons. It can be as simple as retrieving unwanted information multiple times while fetching data to very complex ones like threading, sync/async patterns, wrong design etc. In 7.2, we decided to address the challenges our users faced in few areas of the application.
Screen Load – Host Instances
For an end-user, the key expectation from any web application will be to see the page response in a matter of seconds. Page load time issues definitely is an annoying factor for users. When the application has to interact with a web server, it needs to make use of proper service calls to fetch the information. Failing to use the right calls can result in unwanted information being fetched that can cause the application to slow down.
While diagnosing a different problem, we noticed that a wrong API call had been used to retrieve the host instances information from the BizTalk server. The API call was actually retrieving lot of additional information like throttling settings, host properties, certificate information in addition to the host instances information, which was totally unnecessary in the context. We have fixed this issue by calling the trimmed down API, which only retrieves the host instances information relevant for that screen. We deployed a new build with the code fix and replicated a real world scenario by creating over 30 hosts and 100 host instances. And guess what! The screen loading performance significantly improved and BizTalk360 retrieved the host instances information in a matter of seconds. The time taken to retrieve the host instances information reduced by about 50%.
The below screenshot shows the performance improvement in the Host Instances screen between Version 7.1 and 7.2.

Screen Load – Application Dashboard
During one of our testing cycles, we noted that the application dashboard page took a considerable time to fetch and load the information. The problem is slightly different here. In host instances case, we made the call to API which returned unnecessary data. But in this case, we made unnecessary additional API calls that are not required immediately for current screen.
The unnecessary calls were eliminated and when we tested the fix, the time taken to view the application dashboard was a lot quicker when compared to the previous versions. The below screenshot shows the comparison of performance improvement between Version 7.1 and Version 7.2.

Performance problems for Non-Super Users
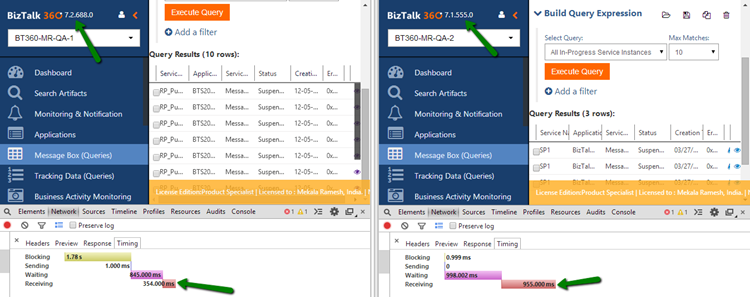
When the application is deployed on-premises, multiple users have different privileges to access the different areas in the system. For Super users, its pretty much unrestricted access across the application. But for a non-super user, lot of additional checks need to be done before serving a request. During one of our testing cycles, while testing the application as a non-super user, we realized that few pages of the application such as Message Box (Queries), Platform Settings took a long time to retrieve and display the information. The page load time was close to 5 seconds! This was a serious issue as performance problems are directly related to user sentiments. Upon analyzing the code, it was evident that the problem occurred while data initialization. Instead of initializing it once and reusing it, some of the underlying API’s were initialized multiple times resulting in multiple database calls. So, in the case when there were, say, 10 applications, the call was made 10 times to the database which is a costly affair in terms of time. We fixed the issue and now the user can see the page in just 350 milliseconds instead of 5 seconds.

Web Endpoints Monitoring
Monitoring is the one key feature that BizTalk360. In BizTalk360, it is easy to set up web endpoint monitoring that will monitor the web services and make sure they return the expected status codes (ex:
http://services.contoso.com/clientauth). When it comes to web end points monitoring, you may be interested to monitors large number of end points (ex: 50). In the previous versions, the check was made sequential and default HTTP timeout (100,000 milliseconds) was used.
Consider the following scenario, say there are 100 endpoints and the checks happen sequentially. During monitoring, the 5th endpoint does not respond with the information. The timeout factor kicks in and the process will still be in waiting state for the next 100 seconds before moving on to monitor the next endpoint. As a result, the user will notice a delay in seeing the monitoring status information.
We have fixed this issue now and changed the way the checks happen. The checks happen in parallel/asynchronous manner. In addition, we have also reduced the timeout value to 15 seconds per call. Therefore, as in the previous scenario when a check hangs during processing, the maximum time taken to get out and move to the next operation is just 15 seconds. And this does not block the other operations as they run in parallel.
These are few of the performance issues that we have addressed in 7.2 Release. The product is still in the growth phase and we already have plans to develop the product with lot more functionalities. As the product becomes feature rich, it is bound to be plagued with performance issues. However, rest assured, we will do our best to nip the bud and deliver quality product to our customers.


