What is a Web Service Endpoint?
In simple terms, a
web service endpoint is a web address (URL) at which customers of a specific service can gain access to it. By referencing that URL, customers can get to operations provided by that service. The endpoint is a connection point where HTML files or active server pages are exposed. Endpoints provide information needed to address a Web service endpoint.
Overview of this blog
- Why do users need Web endpoints?
- Web endpoint monitoring in BizTalk360
- Latest version of BizTalk360 v10.0
Why Web Endpoints
In BizTalk environments, integrations can connect to external web endpoints. To validate the health of the web endpoint, BizTalk360 allows administrators to set up web endpoints monitoring, and validate the actual response code against the expected return code.
Before version 8.1, web endpoint monitoring had the capability to manage the external endpoints using options like to provide authorization credentials and with a proxy. While monitoring the endpoint, if there is any mismatch between the expected return code and actual return code, the system will alert to the administrator with the information. In 8.1 version, we have improved with some more interesting options like Payload and Custom HTTP headers.

Basic Detail
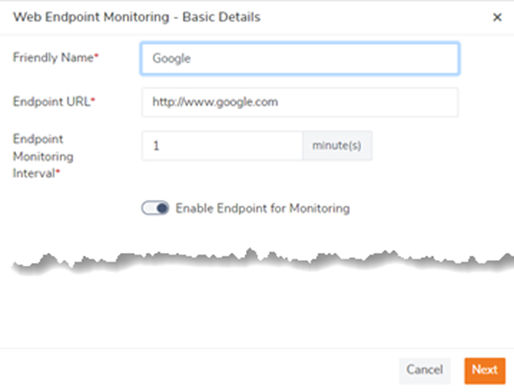
In basic detail, we can give the Endpoint name which is going to be monitored. In Endpoint URL, we can give the URL of the web endpoint for ex.
www.google.com
Optional details configuration
In this section, we can have a deep look at the new optional settings available for monitoring the endpoint. This is an optional section, you can skip this configuration.
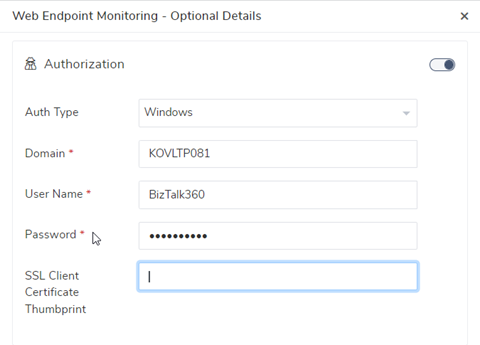
Authorization credentials:
Web endpoint will require Username and Password for monitoring. In that scenario, we can utilize this option. For ex, if we need to access remote machine URL, in this case, we need to specify the domain name, user name, and password. If you can monitor the endpoint without any issue, then it will be healthy else it will return an error message.
Proxy:
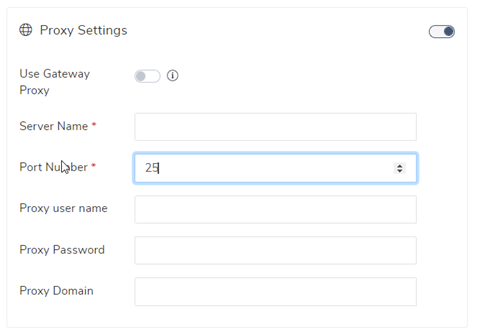
Some organization will be using a proxy, in that case, you can give the proxy details to monitor the endpoint. In you enable the toggle button near the Use Gateway Proxy it will fetch the proxy details which we have given in the settings -> gateway settings. Global gateway settings can be overridden by giving the below details
- Server Name– the name of your proxy server
- Port Number– the port number used to associate through your proxy
- Proxy username– the username to associate with the proxy server
- Proxy password– the password to authenticate the credentials to associate with the proxy server
Payload:
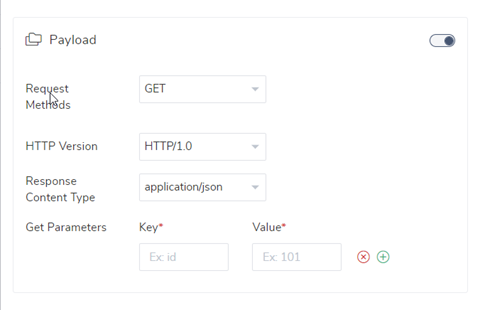
When data is sent over the Internet, each of the transmitted unit includes both header information and the actual data being sent. The header identifies the source and destination of the
packet, while the actual data is referred to as the payload. The part of the message or code that carries the data. In a key-length-value structure, the key and length are descriptive data about the value (the payload). Here we can configure the parameters of GET or POST methods. Some Endpoints cannot be monitored without giving additional parameters. We can retrieve those information’s using payload and monitor those API in web endpoints.
Custom header:
HTTP headers allow the client and the server to pass additional information with the request or the response. You can give custom headers along with the endpoint which you are going to monitor. (Ex: Accept-Charset, Accept-Language, Allow, Authorization, Content-Language)

Response alert configuration
Here comes the response alert configuration section, you can see three type of response format. We will see one by one.
Response Format:
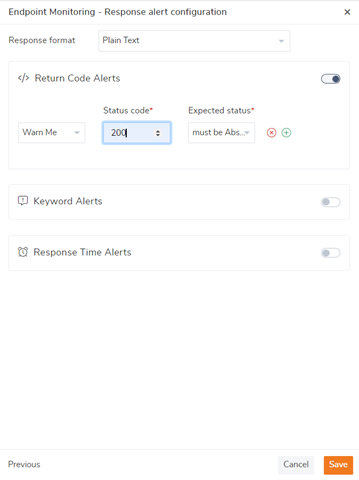
Plain text: In this type, you can see Keyword alert where you can specify the keyword which will be available in the endpoint which you are monitoring
Ex. Let’s go with www.google.com
If you mention the keyword as Success and if it is present in the endpoint the status will be healthy based on the conditions.
 XML
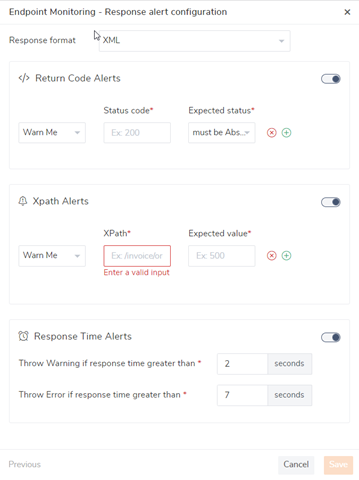
XML: Here you can see _XPath Alerts, you can even monitor your endpoints using XPath.
Ex. You have an endpoint with XML data and you need some specific information in that case you can give XPath and monitor the endpoint. Say, your endpoint is having information about employees and you want to fetch the name of the 3
rd employee, at that time you can give as
//employees/employee/lastName Jones
If the given XPath values are true, then endpoint will be healthy else it will show error/ warning based on the configurations.
 JSON
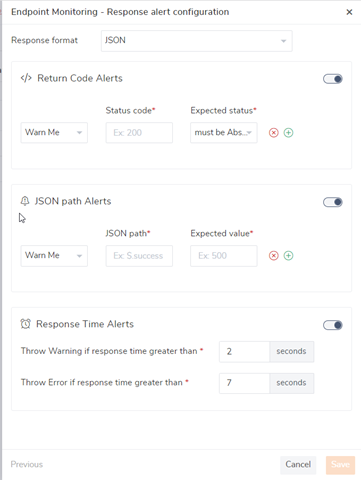
JSON: Same as XPath you can see JSON path alerts, and monitor the endpoint using JSON path. Say, for an example, an endpoint with Json data and looking for some specific data – 3
rd employee:
{“employees”: [
{ “firstName”:”John”, “lastName”:”Doe” },
{ “firstName”:”Anna”, “lastName”:”Smith” },
{ “firstName”:”Peter”, “lastName”:”Jones” }
]}
$. employees [2]..firstName peter
If the given Json path values is true, then endpoint will be healthy else it will show error/ warning based on the configurations.
Return Code Alert:
Endpoints can be monitored based on the return codes. If you set return code as 200 and while monitoring if the endpoint does not have the expected return code. then it will indicate error/warning based on the configuration else it will be healthy.
Response time Alerts:
The same way we can monitor the endpoints using response time. We can monitor the delay of the endpoint using this setting. We can change the response time based on the necessity.
Based on the configuration we have provided we will get the notification in email.
BizTalk360 new release v10.0 is out now!
BizTalk360 helps you to manage/operate and monitor your BizTalk Server environments. Our BizTalk360 team has worked on the v10.0 release for more than a year. Now we have released a new version of BizTalk360 where you will find an even better user experience that enables you to enjoy the latest features that have been developed.
BizTalk360 supports BizTalk Server 2013, 2013 R2, 2016 and also 2020.
Conclusion
So I hope this blog gave you some idea about how you can monitor Web Endpoint in
BizTalk360. If you have any questions, contact us at
support@biztalk360.com. Also, feel free to leave your feedback in our
forum.


 XML: Here you can see _XPath Alerts, you can even monitor your endpoints using XPath.
Ex. You have an endpoint with XML data and you need some specific information in that case you can give XPath and monitor the endpoint. Say, your endpoint is having information about employees and you want to fetch the name of the 3rd employee, at that time you can give as
//employees/employee/lastName Jones
If the given XPath values are true, then endpoint will be healthy else it will show error/ warning based on the configurations.
 JSON: Same as XPath you can see JSON path alerts, and monitor the endpoint using JSON path. Say, for an example, an endpoint with Json data and looking for some specific data – 3rd employee:
{“employees”: [
{ “firstName”:”John”, “lastName”:”Doe” },
{ “firstName”:”Anna”, “lastName”:”Smith” },
{ “firstName”:”Peter”, “lastName”:”Jones” }
]}
$. employees [2]..firstName peter
If the given Json path values is true, then endpoint will be healthy else it will show error/ warning based on the configurations.
 Based on the configuration we have provided we will get the notification in email.
