
Senthil Kumar
Author
Published on : Jun 24, 2026
Category : BizTalk360 Update
BizTalk Server environments are inherently complex managing multiple host instances, orchestrations, send/receive ports, and message pipelines simultaneously. BizTalk Administrators needs clear, real-time visibility across landscape to keep operations running smoothly. Spotting the performance degradation, identifying suspended messages, and detecting infrastructure bottlenecks before they escalate requires consolidated insight rather than scattered, manual checks. As environments grow, so does the need for a centralised reporting layer that turns raw operational data into actionable intelligence helping administrators anticipate issues, prioritise effectively, and spend less time in troubleshooting and more time in resolving the issues.
What BizTalk environments need is a unified, intelligent reporting layer that speaks the language of BizTalk/SQL Administrators and Business Users: operational precision for administrators, transactional clarity for EDI teams, business-level visibility for BAM users, and rapid fault resolution for ESB teams. That is exactly where enhanced BizTalk360 reporting steps in.
BizTalk360 has steadily evolved its dashboard and reporting experience to give every stakeholder a tailored, data-rich view of their integration environment. The most recent releases bring a powerful set of dashboards with custom widgets, which are designed to represent the metrics that Administrators/Business users are interested.
Here’s a quick look at what’s now available:
The latest release rolls out two significant additions. The Administration Dashboard gives BizTalk and SQL administrators a consolidated, real-time view of infrastructure and operational health, while the ESB Dashboard brings clarity to fault handling and itinerary processing. Both are built to reduce the time it takes to move from detection to resolution.
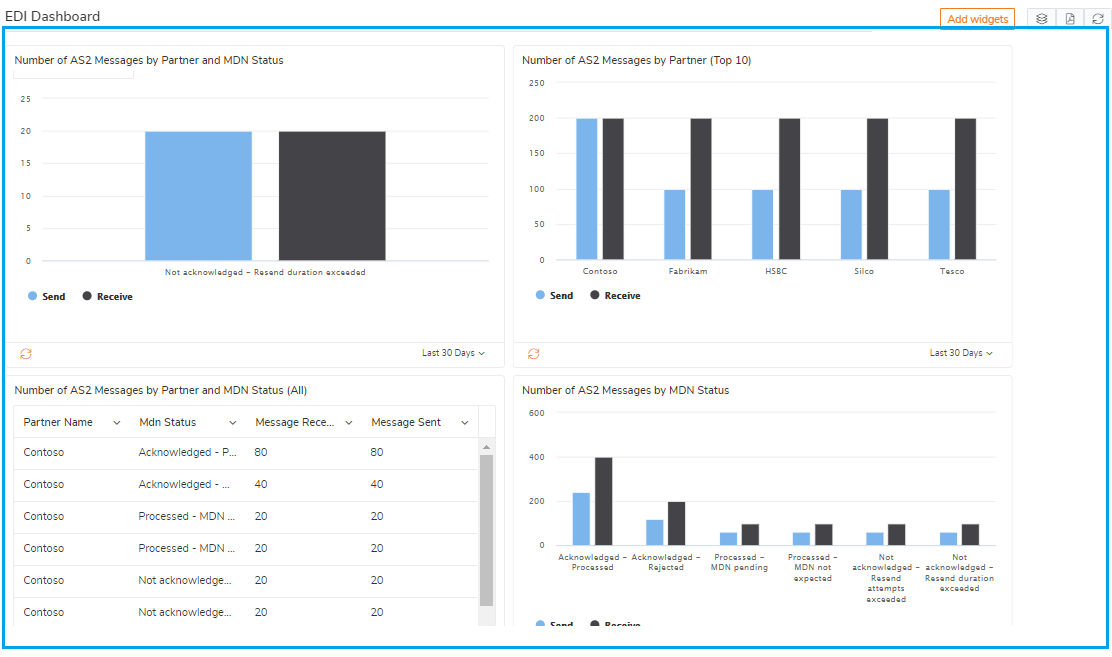
Earlier, version 11.6 delivered the EDI Dashboard and the BAM Dashboard, extending rich visibility to EDI trading partner activity and Business Activity Monitoring data. These dashboards put transactional and business-level insights directly in front of the people who need them without requiring deep technical intervention each time.
A defining theme across all these dashboards is flexibility. The ESB, BAM, and EDI dashboards all support custom widgets, allowing users to configure exactly the metrics they want to track and display. Whether it’s transaction counts, partner-level interchanges, or business milestones, each user can shape their dashboard around their own priorities.
This widget-driven approach extends to the newest dashboards as well. The Administration Dashboard offers configurable widgets covering key operational metrics, and the ESB Dashboard provides custom widgets for faults and itinerary metrics, letting integration teams keep the most critical fault and routing data front and centre.
To summarise where each feature is included in BizTalk360 reporting to share the trend analysis and failure insights, to respective stakeholders with periodic schedules (Daily, Weekly and Monthly)
Together, these dashboards form a cohesive, customisable reporting experience – one that scales across the various metrics.
The Administration Dashboard gives BizTalk and SQL administrators a single, consolidated view of their entire environment’s operational health. Instead of jumping between multiple consoles and queries, administrators get real-time visibility into the metrics that keep integrations running smoothly – all in one place.
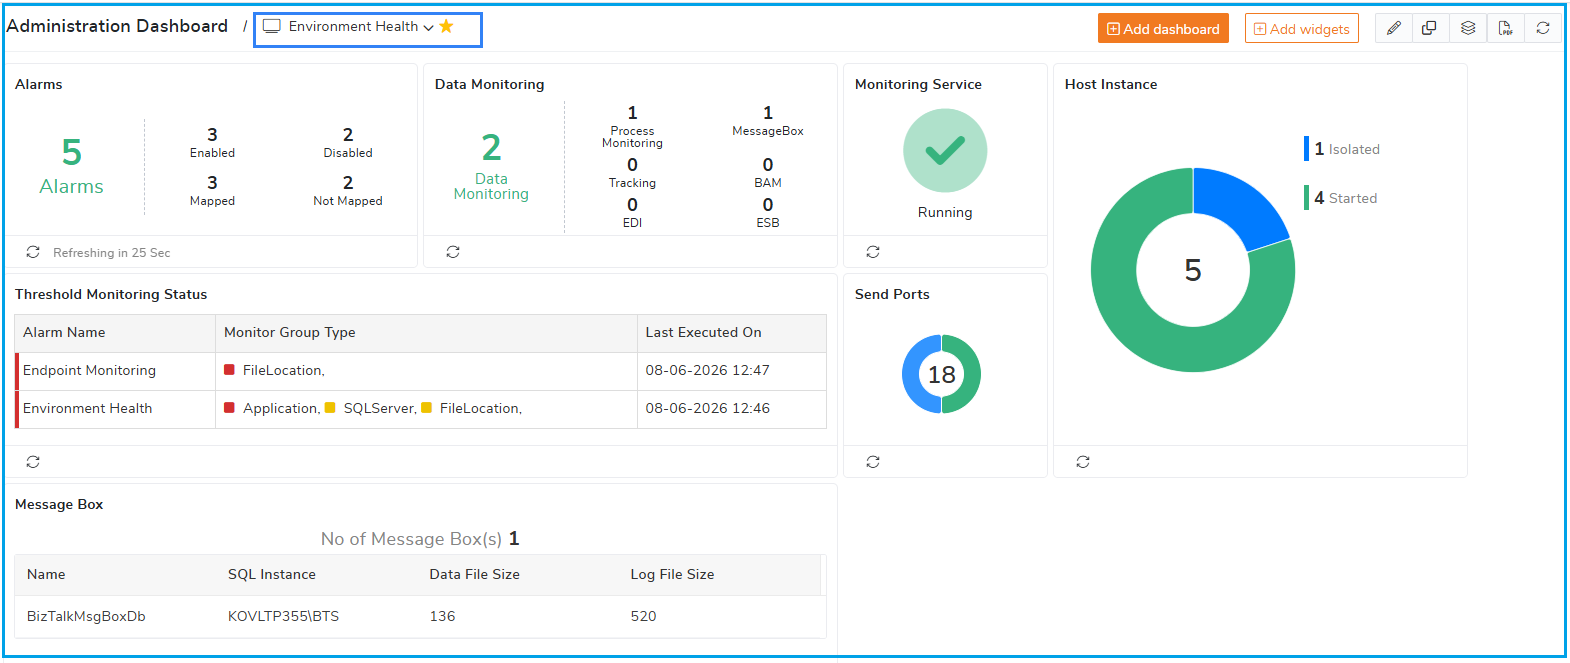
What makes it truly powerful is its flexibility. The dashboard supports a range of configurable widgets, letting administrators build a view tailored to their priorities. Whether tracking host instance status, message processing activity, suspended service instances, or overall system performance, you decide what appears front and centre.
This widget-driven approach transforms the dashboard from a static report into an actionable operational insight.
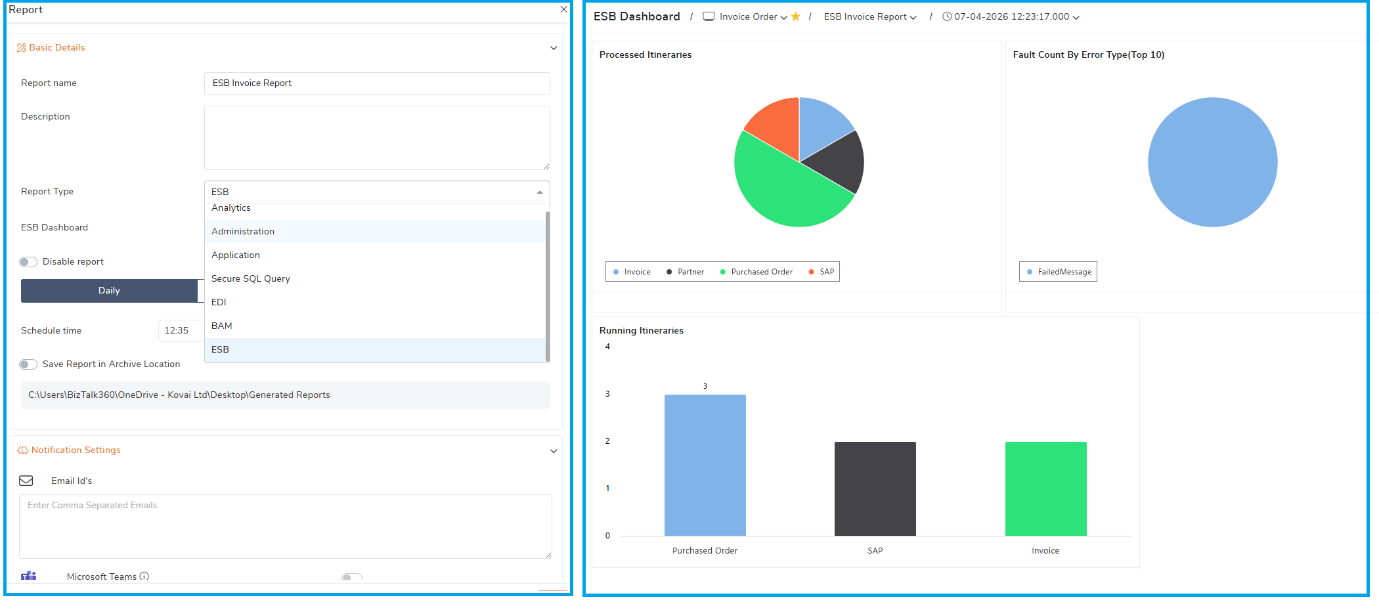
The ESB Exception Dashboard is designed to handle the complexity, transforming scattered fault data into clear, contextual insight that teams can act on immediately.
Rather than discovering failures only after downstream systems are affected, integration teams get a centralised, real-time view of ESB faults and itinerary processing. The dashboard surfaces what’s failing, where, and how often — giving teams the context they need to identify root causes faster and prioritise resolution based on actual business impact.
The real strength of the ESB Exception Dashboard lies in its custom widgets. Teams can configure widgets to track critical metrics like
Consider a manufacturing company that processes thousands of Purchase Orders (POs) and Invoices daily through its BizTalk ESB infrastructure. Purchase Orders arrive from customers via multiple channels, are validated and enriched through ESB itineraries, and are routed to the ERP system. Once orders are fulfilled, Invoices flow back through the ESB transformed, validated, and delivered to customers and the finance system. Every step is governed by dynamic itinerary-based routing across multiple services.
In this flow, a single failure can have a direct business cost. A Purchase Order that fails during validation or routing means a delayed or lost sale. An Invoice stuck in an itinerary step means delayed revenue recognition and frustrated customers. Worse, these failures often surface in different services at different stages making it hard to see whether an issue is an isolated glitch or a growing systemic problem.
With ESB fault and itinerary metrics consolidated into one configurable view, the order processing team gains continuous, contextual oversight:
Dive deeper into the capabilities in the ESB Exception Dashboard documentation.
The latest enhancements to the reporting including ESB, EDI, BAM Dashboards with custom widgets and Administration Dashboard they’re about enabling faster, more confident decisions across the organisation. By combining real-time dashboards with the ability to deliver insights periodically, BizTalk360 ensures the insightful information reaches the right people at the right time, even when they aren’t actively following the analytics data.
For administrators, the Administration Dashboard turns continuous operational data into a decision-ready summary. Instead of manually compiling status updates, administrators can rely on periodic reports that capture infrastructure health, message processing activity, and system performance immediately. This means trends are spotted earlier, capacity issues are anticipated rather than discovered, and routine reporting no longer eats into time better spent on resolution. Decisions about scaling, maintenance windows, or troubleshooting priorities can be made quickly, backed by clear and current data.
For business users, the value lies in clarity and timeliness. The ESB Dashboard surface’s fault and itinerary metrics that, when delivered as periodic reports, translate technical events into business-relevant insight. Business stakeholders can understand the health of critical processes, see where exceptions are impacting operations, and gauge whether service levels are being met all without needing to interpret raw technical logs. This shared visibility bridges the gap between IT and the business, ensuring everyone is working from the same picture.
What ties it all together is the shift from on-demand checking to proactive, scheduled insight. Periodic reports drawn from these dashboards keep both technical teams and business leaders continuously informed, reducing the lag between an event occurring and a decision being made. The outcome is a more responsive where issues are addressed sooner, priorities are clearer, and decisions are grounded in up-to-date, role-relevant data.
In short, smarter dashboards combined with timely reporting mean less time gathering information and more time acting on it.
To know more about the BizTalk360 features, try out the free trial or book a demo.