
Praveena
Author
Published on : Feb 12, 2021
Category : BizTalk360 Update
Performance is one of the main aspects to be considered in any software. In a most heavy traffic network involving servers with a huge volume of message transmissions, it is important to check for the throttling conditions and identify the source for throttling to take corrective measures. When a lot of transactions happen within the BizTalk servers, there may be chances of CPU and memory spiking up and resources become unavailable, thus resulting in throttling. With the servers having multiple hosts, only the BizTalk administrators can understand the cause of throttling. This is made simple with BizTalk360.
BizTalk360 is the one stop monitoring tool for monitoring your BizTalk environment.
With the analytical capabilities of BizTalk360, it’s easy to understand the BizTalk performance counters and the hosts for which the throttling occurs. Performance counters can help you identify and troubleshoot server performance issues. Let us dig in deep to understand how BizTalk360 helps in understanding the performance counters.
A server’s health can be determined by many factors, out of which CPU and memory are among them. Measuring the utilization of the hardware resources within each device in your organization is key to evaluating both the efficiency of devices and the impact of resource consumption on end-user experience. BizTalk Server makes use of several different Microsoft technologies, each of which can consume a significant portion of the memory, disk, and CPU resources available on the BizTalk server and the SQL server that contains the BizTalk Server databases. Monitoring these counters is essential for the smooth functioning of the servers to continue the tasks without any hindrance. Because of its monitoring and analytics capabilities, with BizTalk360 this job is absolutely easy.
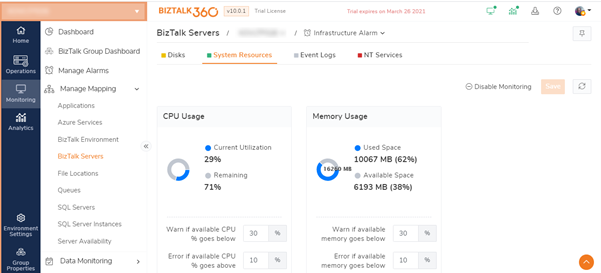
It is possible to monitor the disk and system resources usage of both BizTalk and SQL servers and trigger an alert notification when the usage goes beyond a certain threshold level that has been configured. With this notification, the admin team would come to know about the usage and corrective measures can be taken accordingly.
BizTalk360 collects the data of these performance counters through the Windows Performance Monitor tool (PerfMon) that connects to the BizTalk and the SQL servers.
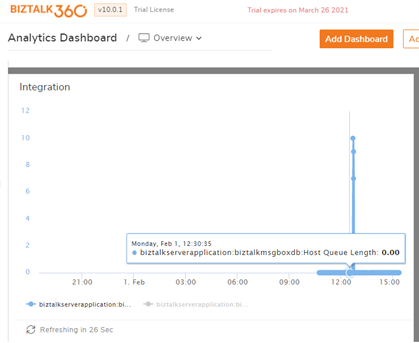
With the Analytics Dashboard capability of BizTalk360, it is even easier to view the performance data as the data will be displayed in a nice graphical way.
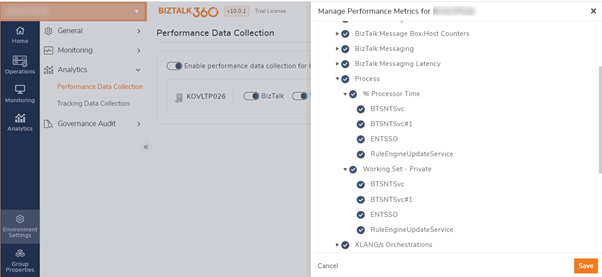
Through PerfMon, the data for the CPU and the memory usage of the servers get collected from the performance metrics selected from the Analytics performance data collection.
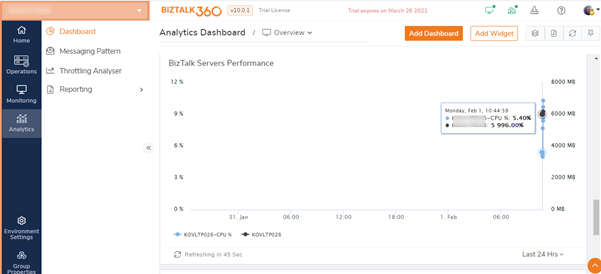
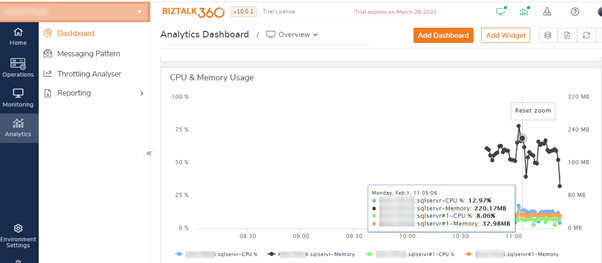
With the help of the Analytics widgets, it is easy to view the performance counter data for the CPU and memory of the BizTalk and SQL servers. If there are more than one BizTalk servers involved in a network, it is also possible to compare the resources between the different BizTalk servers. This comparison can be done with the custom widgets in the Analytics section. Also, these widget’s data can be sent by email in a PDF format with the BizTalk360 Reporting feature.
The BizTalk Messaging Agent counters play an important role in a BizTalk Integration. These counters will impact the transactions if there is any delay seen. With the BizTalk360 Analytics widgets, it is possible to view the details of the BizTalk Messaging performance which would display the details of the average execution time, message delay and the message count for the transactions that occurred during the selected datetime range.
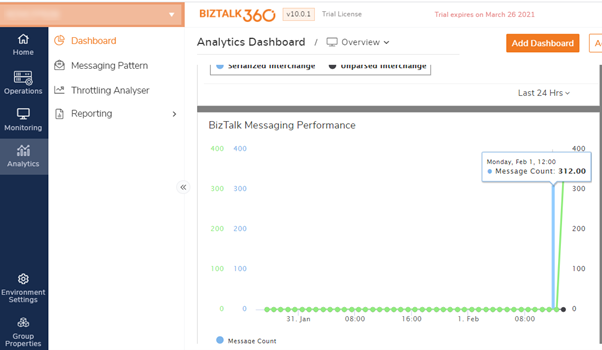
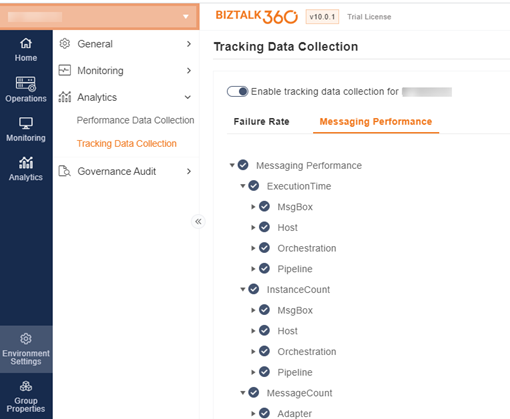
The BizTalk Messaging agent counters and the messaging latency are considered, and the values will be calculated based on these counters. When the tracking data collection is enabled and these performance metrics are selected in the BizTalk360 Analytics section, the graphical representation of these counters can be viewed in the form of widget data.
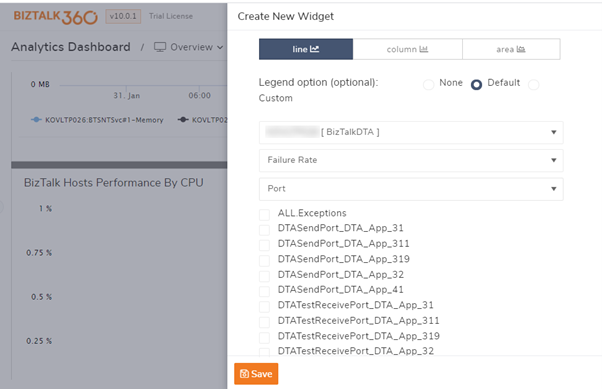
Not all messages get transmitted successfully and there may be failures. It is also important to know the failure rate of these transactions so that the failed messages can be resumed or terminated as per the business requirement. BizTalk360 gives a clear view of these transmission failure rates differentiating for each port and schema. It is also easy to get the failure rate for each port by selecting the ports in the Analytics custom widget. The data can also be viewed for the last 30 days or last 7 days or for 24 hours.
Similarly, the instance count for each of the ports can also be determined from the Analytics widgets.
A BizTalk Server Host is a logical set of zero or more BizTalk Server run-time processes in which you deploy items such as adapter handlers, receive locations (including pipelines), and orchestrations. A host instance is a process where message processing, receiving, and transmitting occurs. The performance of the hosts must be taken care of, otherwise, it would result in host throttling. BizTalk Server employs a throttling mechanism to help manage the use of available resources to minimize resource use contention.
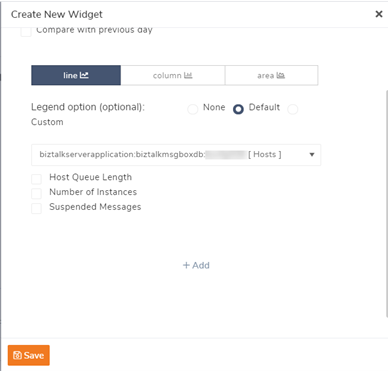
BizTalk administrators would keep an eye on the host throttling performance counters that measure system parameters that impact host throttling. These performance counters are accessible for each host instance under the BizTalk: Message Agent performance object category. The counters like CPU and memory usage of the top performing hosts, the active instance count, host queue length can be graphically visualized using the Analytics widgets in BizTalk360.
To manage the use of resources by a host instance process, BizTalk Server utilizes an adjustable throttling mechanism that governs the flow and processing of messages through a host instance.
The throttling mechanism moderates the workload of the host instance to ensure that the workload does not exceed the capacity of the host instance or any downstream host instances. The throttling mechanism also prevents a condition known as resource contention that can lower the overall performance of the host instance process or other system processes. The BizTalk Server host throttling mechanism helps to ensure that the system operates at an optimal and sustainable level.
There is no easy mechanism to find out if the throttling has occurred in the BizTalk environment unless the BizTalk admin identifies it while checking for the host throttling performance counters.
With BizTalk360’s throttling analyser, it is easy to identify when the throttling has occurred, the source of the throttling, and for which hosts it has occurred as the dashboard is plotted at almost real-time. Without much throttling experience, the support personnel can easily understand when and why your resources are actually throttling.
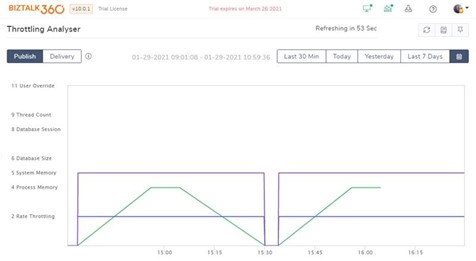
See above, the rich dashboard with the colour coding to differentiate the hosts instances with the clear and detailed throttling information.
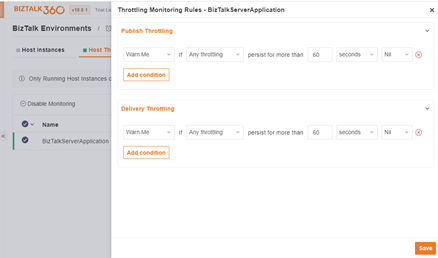
What if you wanted to get a notification when the throttling occurs? Yes, it’s even possible with BizTalk360 Host throttling monitoring capability. The clustered hosts can also be monitored for throttling and these details like the source and the throttling duration would be sent in the alert email when the throttling occurs.
This is one of the common problems which many BizTalk users face often:
Some of the BizTalk performance counters suddenly disappear from the list.
Let us consider a scenario,
BizTalk Servers can spike in CPU and Memory when many transactions occur.
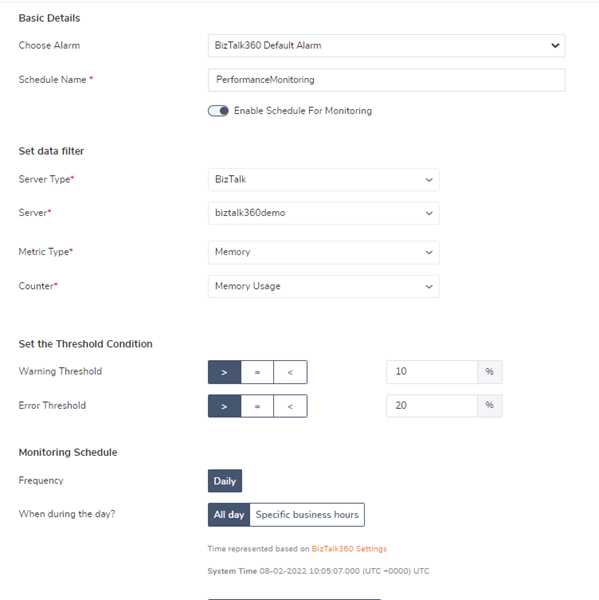
For such scenarios, BizTalk360 offers the feature of Performance data monitoring which helps administrators to understand BizTalk/SQL Server performance metrics frequently.
Follow the link to learn more about this feature and see how you can set up and schedule BizTalk performance counters.
BizTalk360 contains ample features that help in monitoring the BizTalk environment and identifying the performance issues related to the BizTalk and SQL servers. With BizTalk360, it is easy to understand the performance counters and take necessary actions for tuning the server performance. Still, it does not stop here. We have also integrated with third party products like New Relic, App dynamics, and Dynatrace where the Analytics data can be viewed.
Why not give a trial on BizTalk360 and check how does it help in maintaining a healthy BizTalk environment? Happy monitoring with BizTalk360! 😊