BizTalk360 is a tool for operating, monitoring and getting analytical information for BizTalk environment(s). BizTalk360 comes with productivity tools like the Advanced Event Viewer, the Throttling Analyzer, the Backup/DR visualizer, the BizTalk Health Monitor etc. These tools are also designed to help support people to perform their activities in a seamless way. BizTalk Server, being middle-ware, high volumes of data passes through the Message Box. Based on the business requirements, Tracking is enabled for important BizTalk Integration transactions.
In similar fashion, BizTalk360 collects important information to perform various activities in operations, monitoring and analytics section. In this article, we show BizTalk360’s data collection features and how you can configure the settings to optimize the data collection.
The Event Log is an important component which is used by BizTalk Administrators to investigate, if any configuration or transaction errors have happened in BizTalk Server. The Advanced Event Viewer is a powerful feature in BizTalk360 which in fact is a central repository for collecting the event logs from multiple BizTalk servers and SQL servers in BizTalk environment. It has the capability to filter the event logs by various parameters like Event Id, Event Type, Sources etc.
The BizTalk360 Monitoring service collects the event log information based on Event Logs and Event Sources which are configured in the BizTalk360 Advanced Event viewer settings.
BizTalk360 uses Windows Management Instrument (WMI) queries to collect the event log details from BizTalk Servers and SQL Servers in an environment. In a multi-server BizTalk environment, few customers raised concern about BizTalk360 IOPS (input/output operations per second). In this set-up, there is change of high volume of IOPS in BizTalk360 Box (Monitoring Service).
BizTalk360 Recommendation
To avoid large volume of data collection or to improve the performance of the BizTalk360 monitoring services, following event log configuration are suggested
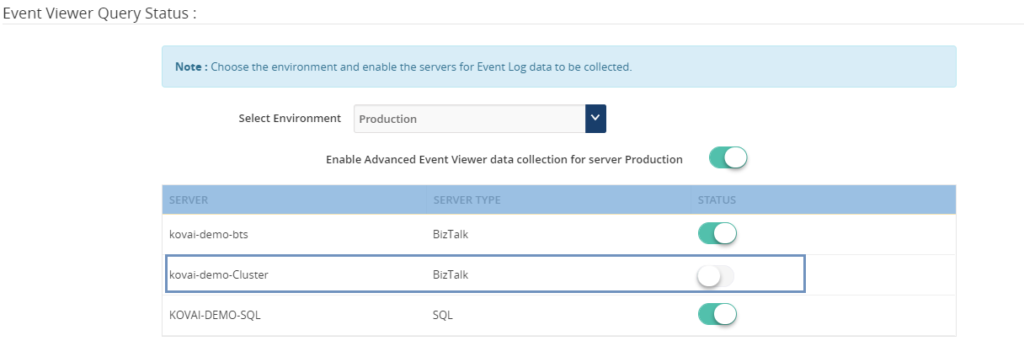
1. Enable the necessary servers to collect Event Logs and Event Sources
• Primary BizTalk Servers in Active – Passive scenario
• Multiple SQL server, enable the event log data collection for important nodes.
2. BizTalk360 provides a default set of Event Logs and Event Sources which are widely used in BizTalk and SQL servers. Configure the necessary Event Sources that are required as per the business requirement:
• BizTalk Event Log Sources(Default):
Bam Event Provider, BamManagementUtility,BAMWebServices,BizTalk DW Reporting, BizTalk Server, BizTalk Server Deployment, BizTalk Server EDI, BizTalk360 Monitor, BusinessRulesEngine, ENTSSO,MSDTC,MSDTC Client, RuleEngineUpdateService, System.ServiceModel 4.0.0.0, System.ServiceModel.Install 3.0.0.0,W3SVC-WP,XLANG/s
Configure required BizTalk Sources as
“BizTalk Server,BizTalk Server Deployment,BizTalk Server EDI,ENTSSO,MSDTC,MSDTC Client,RuleEngineUpdateService”
• SQL Sources(Default):
MSSQLSERVER, MSSQLSERVER$AUDIT, MSSQLServerOLAPService, SQLSERVERAGENT
Configure required SQL Sources as
“MSSQLSERVER, SQLSERVERAGENT”
Note: This configuration will reduce the BizTalk360 Input/Output operations. You can read this article to know more details about Event-Log Data collection configuration.
In a data-driven business setup, there will be scenarios where critical executive decisions are made based on the performance reports of various components of the listed servers in a BizTalk environment. BizTalk360 aims to offer an out of the box tool with similar capabilities as the Performance Monitor tool in Windows servers.
BizTalk360 Analytics offers visual display of the most important performance counters that are consolidated and arranged on a single screen so that the information can be monitored in a glance. Custom reports can be built in minutes with the metrics that really count for your business, and they are easy to share with other users. In addition, dashboards can give you a summary of many reports on a single page using drag-and-drop widgets for fast and easy customization.

Performance metrics data collection can be optimized by selecting the necessary metrics (Windows, SQL, BizTalk and IIS) based on the server type.
• BizTalk Server: Enable Windows, BizTalk by default. Web Application is configured in the server enable IIS and similarly to SQL.
• SQL Server: Enable Windows and SQL performance metrics
Initial design of the tracking data widgets was simple; it ran the necessary queries directly against the Tracking database and displayed the results in a graphical form on the widget. A larger database degraded the performance of these queries and it had a direct impact on the user experience of the Analytics dashboard, causing slower widget loading and occasional time outs. Since Analytics widgets offered users the option to view data up to 30 days within the widget, an efficient approach was required to improve the performance and user experience.
In BizTalk360 v8.3 to overcome these challenges, we decided to create a service that runs in the background. This service collects the tracking data periodically in small chunks and thereby avoid running expensive queries on the Tracking database. Here, only the resulting metrics are collected rather than pulling all the tracking data to BizTalk360 database. This improves the overall performance of the Tracking widgets as they are not querying the Tracking database directly.
BizTalk360 Analytics needs the tracking data to represent data in custom widgets
• Failure Rate by Port and Schema
• Message Performance by Host, Orchestration, Pipeline, Adapter, Port and Schema
BizTalk360 suggests enabling the data collection for categories and counters needed in custom widgets. If you want custom widgets for Failure Rate and Message Performance of Port and schema, enable only those counters in Tracking data collection.
Collecting the necessary data is important to be able to represent the data in BizTalk360. However, you don’t want unlimited growth of your BizaTalk360 comes out of box with the “Data Purging” feature to able to manage the size of BizTalk360 database. If you want to know more about Data Purging please read this article.
Constantly manual monitoring the database size is a tedious process. You can utilize the Database Query monitoring when the database size is grown over the threshold limit.
SELECT total_size_mb = CAST(SUM(size) * 8. / 1024 AS INT)
FROM sys.master_files WITH(NOWAIT)
WHERE database_id = DB_ID()
We hope this article is useful to optimize and manage the data collection for various features in BizTalk360.
Get started with the free 30 days trial. For any queries/feedback please write to us support@biztalk360.com.