Senthil Kumar
Author
Published on : Feb 3, 2017
Category : BizTalk360 Update
--Data File
SELECT (size*8)/1024/1024 SizeINGB
  FROM sys.master_files where Name = 'BizTalkDTADb'

--Log File
SELECT (size*8)/1024/1024 SizeINGB
  FROM sys.master_files where Name = 'BizTalkDTADb_log'
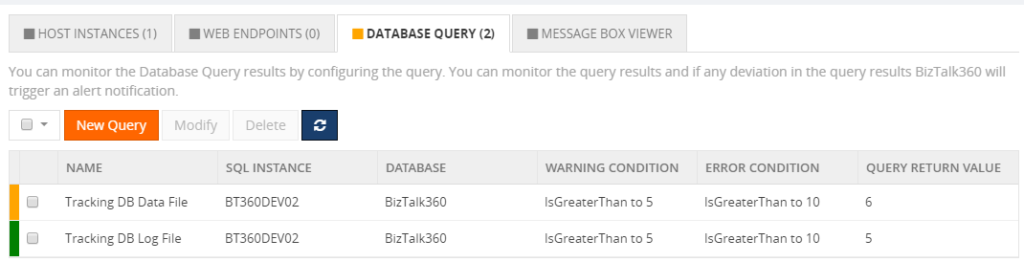 Other database files (Message Box, BizTalk360) can be configured in DB Query Monitoring as well, enabling you to monitor those databases too.
 <div id="WidgetScroll" style="top:30px;" data-bind="addScrollBar: WidgetScroll, scrollCallback: 'false'">
 <table class="table table-lists">
 <thead>
<tr>
 <th style="width:60%">Data File </th>
 <th style="width:20%">Size in GB </th>
 <th>Status</th>
 </tr>
 </thead>
 <tbody>
 <!-- ko foreach: dataFiles -->
 <tr>
 <td data-bind="text: name"></td>
 <td data-bind="text: currentReturnValue"></td>
 <td><span data-bind="text: monitorEnum[currentMonitoringStatus]"></span></td>
 </tr>
 <!-- /ko -->
 </tbody>
 </table>
</div>
 <script>
 dataFiles = ko.observableArray();

 monitorEnum = {
 "0":"Critical",
 "1":"Error",
 "2":"Warning",
 "4":"Healthy"
 };


 activate = function () {
 var _this = this;
 _this.getDataFileSize(function (data) {
 _this.dataFiles(JSON.parse(data.serializedMonitorConfig));
 });

 };
 getDataFileSize = function (callback) {
 var url = 'http://localhost/BizTalk360//Services.REST/AlertService.svc/GetAlertMonitorSerializedConfig';
 $.ajax({
 dataType: "json",
 url: url,
 type:"GET",
 username: "BizTalk360",
 password: "*********",
 data: { environmentId: 'cb763cb7-61f2-4539-a8da-04dcc3cabb0d',   alarmId:'e3468777-b6a1-4db2-b3bf-3d788c6a8452',
 monitorGroupType:'BizTalkEnvironment',monitorGroupName:'BizTalk Environment',monitorName:'Database Query' },
 cache: false,
 success: function (data) {
 callback(data);
 },
 error: function (xhr, ajaxOptions, thrownError) { //Add these parameters to display the required response
 alert(xhr.status);
 alert(xhr.responseText);
 },
 });
 };
 activate();
</script>

<pre>
</pre>
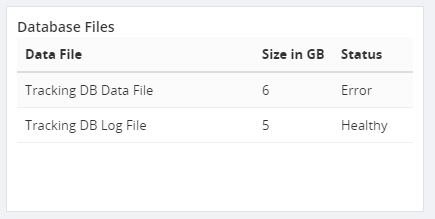
After the creation of the Custom Widget as described above, add the Custom Widget to the dashboard. Thereafter you can see the results as below –