Published on : May 23, 2017
Category :
BizTalk Server Support
At times you might need SQL profiler traces to identify the calls made to SQL from BizTalk to troubleshoot Biztalk issues such as BRE. In such cases SQL Profiler traces is very useful.
STEPS TO COLLECT SQL PROFILER TRACES
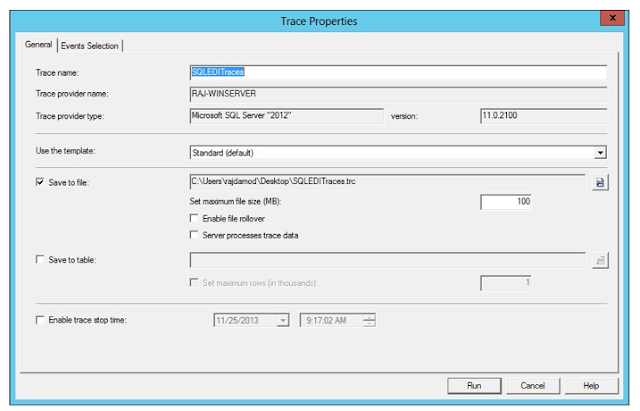
- Open SQL Server > Tools > SQL Server Profiler
- Select the “Save to File” option and select an appropriate folder.
3. Go to “Events Selection” tab and select “Show all events” and “Show all columns” checkboxes.
4. Select the following events
-
- Errors and Warnings
- Exception
- Execution Warnings
- User Error Messages
- Sessions
- Stored Procedures
- RPC:Starting
- SP:Completed
- SP:Starting
- SP:StmtStarting
- TSQL
- SQL:BatchStarting
- SQL:StmtCompleted
- SQL:StmtStarting
- Make sure that you select “Duration” and “RowCounts” columns along with the default columns that were already selected.
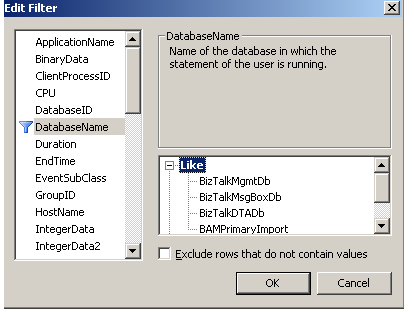
- Click on “Column Filters …” button and in the “Edit Filter” box, select “DatabaseName”. In the right section, expand “Like”, add BAMPrimaryImport and click on OK.
6. Click on “Run” button to start the SQL Profiler trace.
- Stop when you think the issue has resurfaced a good number of times.