
Data monitoring in BizTalk360 is one of the key capabilities that allows you to monitor and trigger alerts based on historical events. Some of the common use cases of data monitoring include “No Event Alerting”. Ex: If you are expected to process 5 purchase orders from an FTP location every hour and you haven’t received the expected volume, then BizTalk360 can alert you with a message.
How many times in a day does the support person have to watch for suspended instances in a particular application and take appropriate action, or look out for ESB exceptions with a particular fault code? Wouldn’t it be nice if there was a way to set up monitoring on a particular data filter, get notified when there is a violation, and take action automatically depending on the actual situation? Yes, that’s exactly what BizTalk360 achieves through the concept of data monitoring, which was a result of customer feedback.
It is a basic requirement to monitor the health of any integration platform or the BizTalk environment for the smooth running of the business. If anyone artifact runs into an issue, the entire business process will be affected. It is not only the artifacts that play an important role, the data that is transmitted is also equally important in a business process.
It is important to monitor the data flow if the transmission is successful, whether the expected number of files are processed in a particular time or not and much more. This is where the data monitoring feature in BizTalk360 comes into play. Users can configure error and warning thresholds to check for the data points and get notified when the threshold is violated.

As it is a known fact that BizTalk360 is one stop monitoring tool for monitoring and managing the BizTalk environment. BizTalk Server being an integration tool integrates various resources and the message transmission happens between them. It is important to keep an eye on the number of suspended instances, understand the reason for suspension and take action accordingly.
In the native BizTalk Server environment, it would be always dependent on the BizTalk administrators to query from the BizTalk admin console and act based on the error code or the error message. This can be easily done through data monitoring in BizTalk360 with simple configurations and the tasks can be automated. The monitoring can also be scheduled for a particular time duration so that the business-critical applications can be monitored.
It’s not only the suspended instances but also important to check for the ESB failures, performance metrics and also event logs. With the variant options and scheduling this is possible in BizTalk360 without even going to the servers or getting into the BizTalk admin console. This would be helpful for the operators and the support group who can get the data in the BizTalk360 UI and view the necessary information in the UI as well as receive it in the alert email.
For any software product, customer feedback is an important aspect, and the product features will be added and enhanced based on the suggestion and feedback. BizTalk360 has also evolved based on customer feedback and data monitoring are one such feature. As the product evolved, more options have been added and the dashboard also has been enhanced.
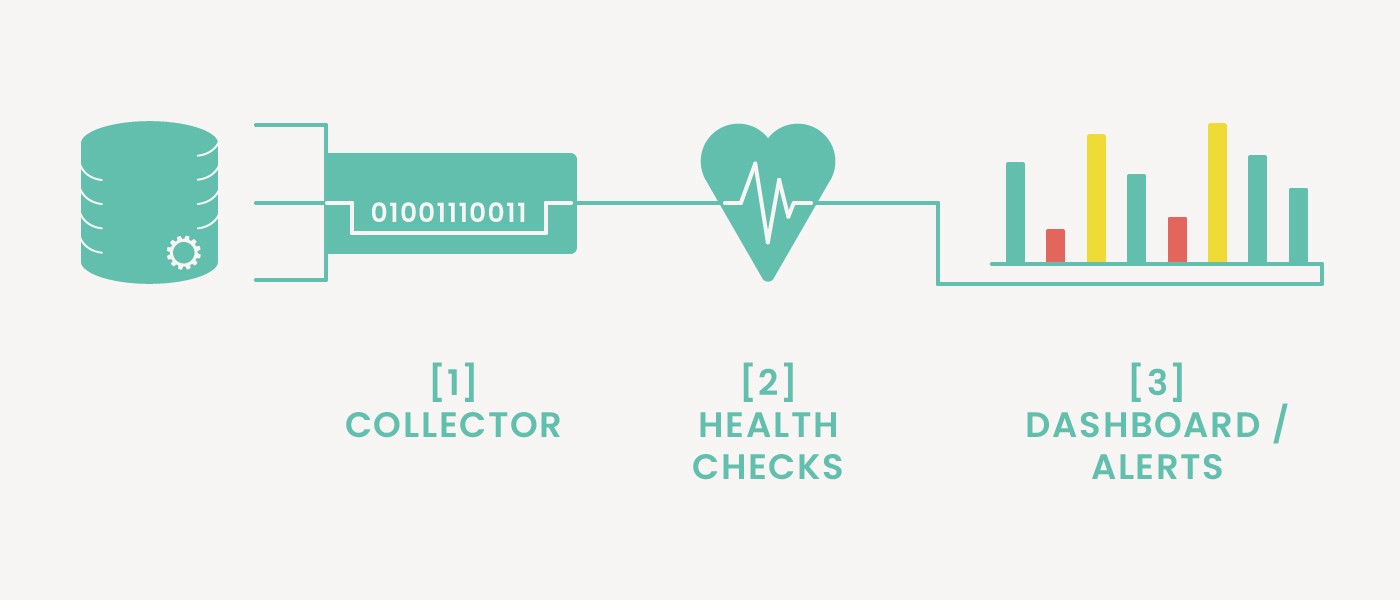
Let’s have a look at the different data monitoring schedule types.

There are three different types of alarms used in BizTalk360, threshold, health check (state-based monitoring) and data monitoring.
When the user wants to get notified immediately when there is a violation, then they can go for the state-based monitoring alarms. Whereas the data monitoring alarms can be used based on the data points and can be scheduled for a particular duration of time, during critical business hours or the end of the business day or for every one hour.
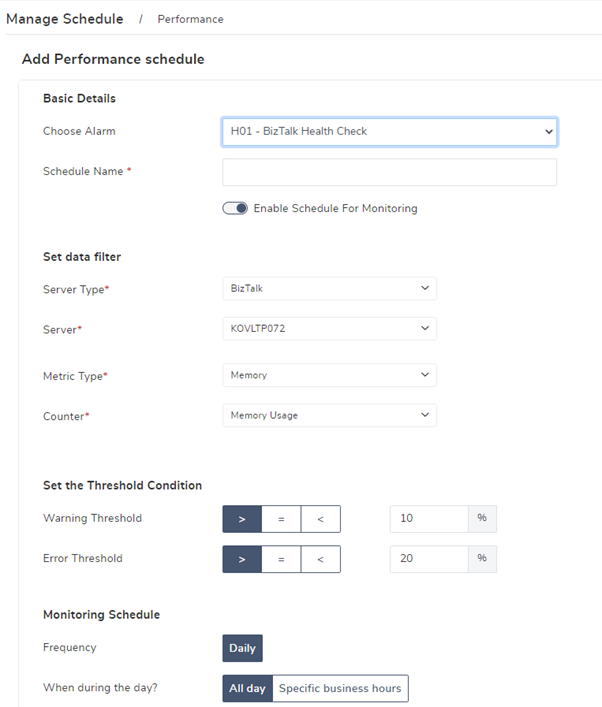
The performance of the server containing the details of the disk usage and system resources is one important aspect to be monitored. Consider an eCommerce application processing thousands of orders in a day. In this scenario, there may be a chance of CPU and memory spiking up and hence the resources would become unavailable.
With the performance data monitoring, it is easy to understand the health of BizTalk/SQL Server with windows performance metrics at frequent intervals. The average metric usage for the configured frequency can be monitored and the average metric status will be notified based on the threshold condition.
This will help the network administrators to take corrective actions to make the resources available thus allowing the business processes to continue without any interruption. This will reduce the work of logging into each of the actual servers and checking for performance metrics.
The process monitoring checks for the number of files processed through the ports in a certain period. In the eCommerce integration scenario, the receive location may be waiting for files to process an order. There might be some problems if no files are received for a certain time period. This can be checked only with help of the BizTalk administrator.
But the BizTalk360 process monitoring feature makes it easy by getting the actual count of messages that have been processed through the BizTalk ports. If the files are not received on time, then the support team can check for the cause and take necessary actions.
In a hospital management process, blood reports play a major role. These reports must be transmitted to various departments for analysis. If for some reason the reports are not received on time and the messages get suspended, then it may lead to serious problems. It is also important that if they get suspended, they need to be resumed to be reprocessed for the transaction to complete.
Wouldn’t it be nice if there is an automated task that takes care of this. Yes, this is BizTalk360 Message Box data monitoring. The user can configure the options and the actions and relax for BizTalk360 will do it automatically that too in bulk mode. The status of the action is also displayed in the data monitoring dashboard as well as in the alert emails.
Another added advantage of this option is the error description, context properties and message content can be sent along with the alert email which will again be helpful for the team to understand the cause of the problem.
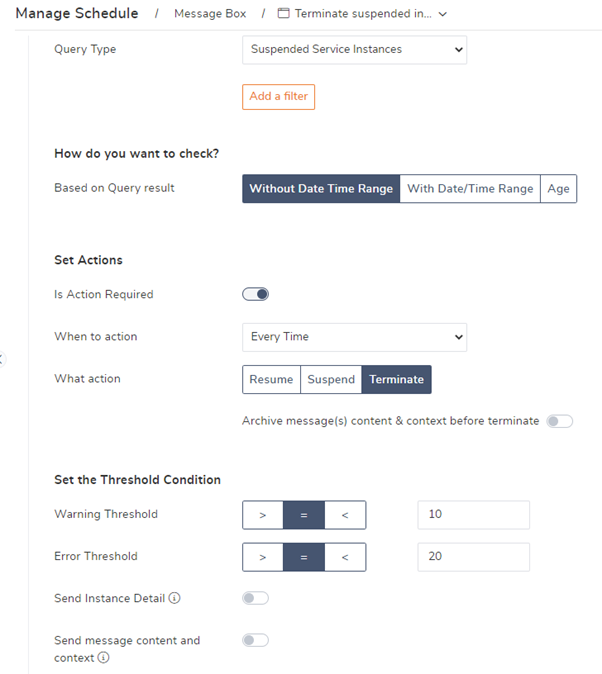
If not for BizTalk360, this again would need a BizTalk admin to go to the BizTalk admin console and then check for the data and perform the necessary actions.
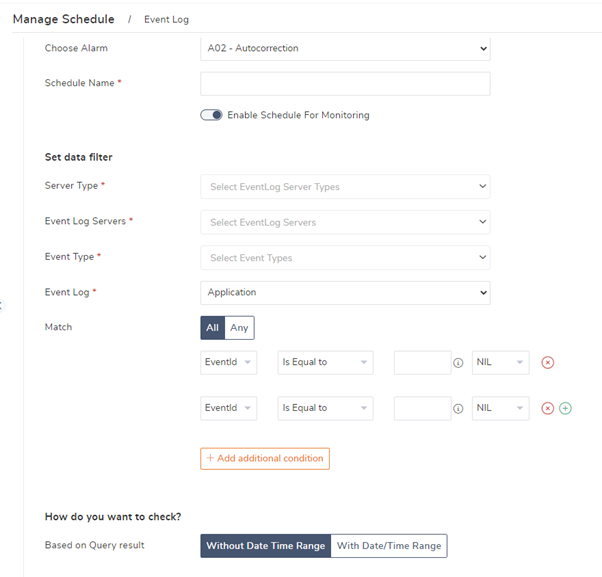
For any exception in the BizTalk environment, the first place a user goes looking for is the event logs as they will contain the exact error information. It would be cumbersome to login into the BizTalk and SQL servers each time and check for the event logs. With BizTalk360 event log data monitoring, it is easy to check for the event logs, and get the count of the logs and the event log message information in the alert email.
Wouldn’t it be nice if we see all this information in one place? Yes, BizTalk360 provides you with this option where data can be filtered with more options and conditions.
An additional filtering capability is that the event logs can be filtered based on multiple event ids.
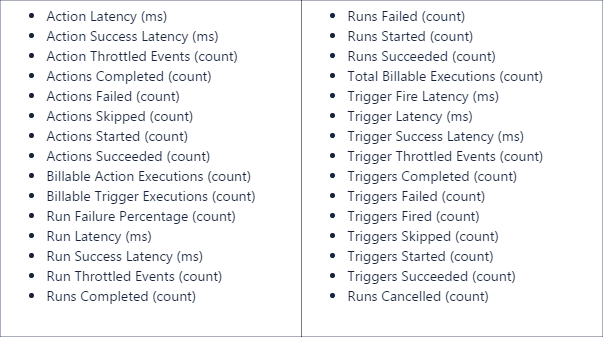
With the integration platform moving to the cloud space, it is equally important to take care of the Azure artifacts. Microsoft is positioning Azure Logic Apps as the integration platform in the cloud mainly for connecting SaaS-based solutions like Dynamics 365, Salesforce, ServiceNow, Workday etc. With the help of Azure Logic App adapter with BizTalk Server, the on-prem systems can be integrated with Azure Logic Apps seamlessly.
With the huge list of metrics available in data monitoring, the number of successful runs, and billable trigger executions can be monitored.
The options in the monitoring section can be configured purely based on business requirements. But here are a few best practices that can be followed for effective monitoring.
With the latest version of BizTalk360, we are receiving positive feedback from customers with regard to the new UI and the user experience. More features and enhancements are on the way with every release of BizTalk360. BizTalk360 v10.4 is in the development stage. Why not give try the latest version of BizTalk360 for efficient monitoring of your BizTalk environment? Happy monitoring! 😊
1хбет предоставляет своим пользователям возможность делать ставки на широкий спектр спортивных событий.
Aviator, kullanıcı yorumlarına göre yüksek güvenilirliğe sahip bir oyundur.
Промокоды на 1win помогут увеличить ваши выигрыши.