Vaishnavi Thiruppathi
Author
Published on : Dec 4, 2023
Category : BizTalk Server
BizTalk360 eases the process of accessing various formats of IIS Logs. Users need not switch between multiple servers to examine the IIS Logs. Instead, they can add their IIS Server in BizTalk360 and enable logging. Once logging is enabled and configuration paths are specified, IIS logs will get collected in BizTalk360.
Assume a scenario where a user is responsible for maintaining a business website that experiences slow loading times. The “time taken” field in the log can help users identify requests that are taking too long to process. Users can sort or filter the logs based on the time taken field to focus on the slow requests.
This can be quickly troubleshooted in BizTalk360 with the rich querying and filtering capability. Once the slow requests are identified, users can examine the log entries for these requests. That helps users to gather information such as the requested URL, client IP address, user agent, and more. This data can help users pinpoint the specific pages or resources causing the slowdown. All this information can be viewed in BizTalk360 without navigating to the actual server.
BizTalk Server manages transactions between multiple business-oriented organizations. When errors or critical issues arise, users would typically need to switch between different servers to access the BizTalk logs and troubleshoot them.
BizTalk360 simplifies the process of accessing BizTalk Logs. Assume a scenario where a user is responsible for managing a complex order processing system for an e-commerce business if the system encounters issues that need to be addressed immediately. This ensures that the orders are processed efficiently.
To identify any issues that block the order processing, the first thing that can be done is to examine the BizTalk logs. By doing so, users can look for errors and warnings related to real-time business. With rich querying and filtering capability, users can drill down and view the logs, which helps users identify the entries that have issues.
Alert Escalation policies are designed to make sure that critical issues are detected and addressed promptly with proper levels of authentication. The primary advantage of using escalation policies is to ensure that the critical issues are identified and notified to the right level of users following a systematic approach.
Assume a scenario where any of the artifacts in the BizTalk Server environment becomes inactive. This can disturb the business flow, which may lead to profound consequences. In such scenarios, it is important for users to address the issues promptly.
Once BizTalk360 detects such a violation in the environment, an incident will be created and recipients in the first level of support will receive alerts immediately so that users can take necessary actions. When the incident is neither acknowledged nor closed, alerts will be escalated.
Process monitoring helps assess the specified send ports and/or receive locations. It monitors the message transactions carried out within a given amount of time.
In prior versions, the process monitoring focused on counting the messages exchanged between send ports and receive locations. However, now, users can also monitor the size of the messages that are transmitted between these ports.
Assume a scenario in which users receive a message of 5 MB regularly. Due to certain reasons the contents of the message might be missed, or the message is sent empty. In this case, users can utilize the Message Content Size Monitoring feature.
Users can monitor the message content size by enabling the “Set Expected Message Size” in the Message Threshold settings and customizing the message size according to their requirements. By default, the expected size will be set as Greater than 0 bytes. If the message size matches the defined threshold, users will receive an alert indicating that a violation has occurred.
BizTalk360 Advisor collects usage data for each available module within the BizTalk360 application. Based on the data collected, it generates usage recommendations. This not only benefits users but also helps the BizTalk360 team. By examining the usage recommendations of the user, the BizTalk360 team can find the features that are least used. Hence, the BizTalk360 team can update the users and promote the unused features. This, in turn, contributes to the product’s growth and enhances user satisfaction.
The recommendations are categorized as “Highly Recommended,” “Suggested,” and “Consider.” Users have an option to choose the levels of recommendations in the Knowledge Base (KB). These changes will be reflected in the next cycle of collecting data and showing recommendations.
If any features are not used or if any configurations are not done, these are identified and sent to the users. By reviewing these recommendations, users can enhance their usage of BizTalk360.
Assume a scenario that the user is using a Platinum tier license. In this case, the user has access to all modules of BizTalk360. If the environment is not enabled with performance data collection or tracking data collection, a recommendation is sent to the users. This encourages users to enable those to optimize their usage of analytics features.
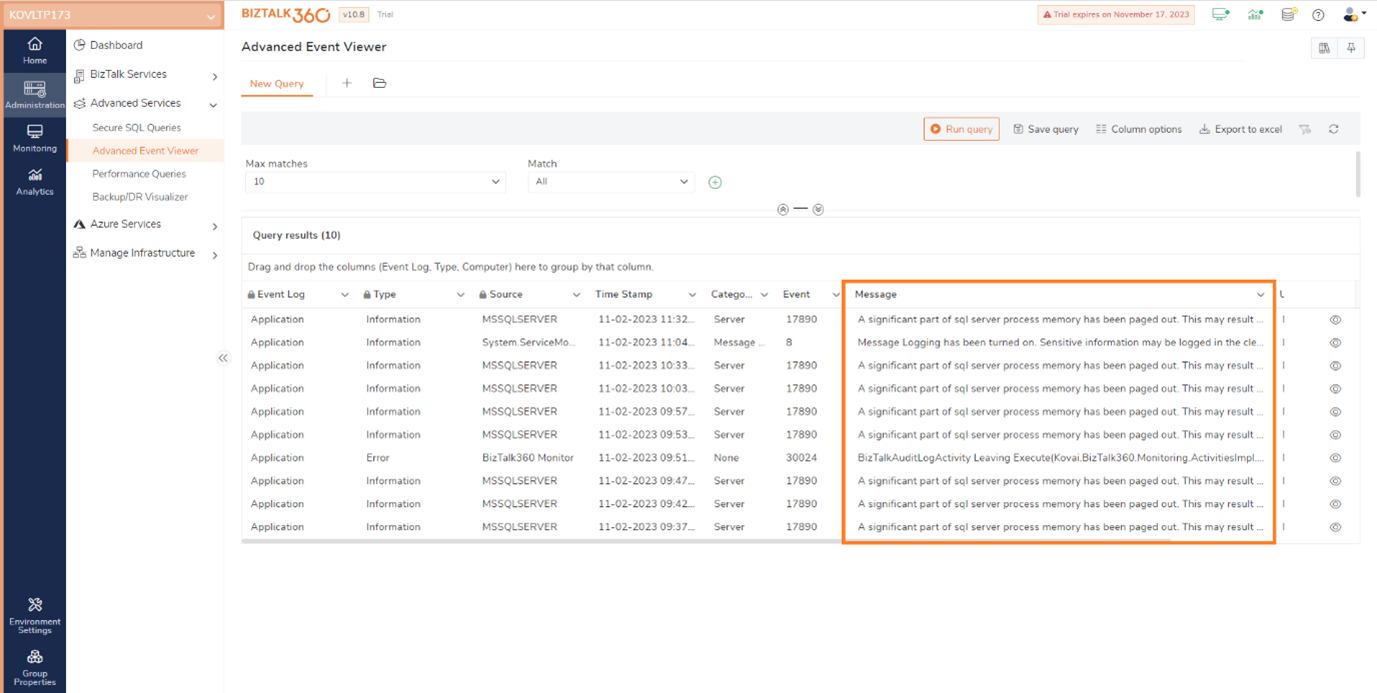
The Advanced Event Viewer now includes an additional column for error descriptions. This is useful for users to review the event log error details.
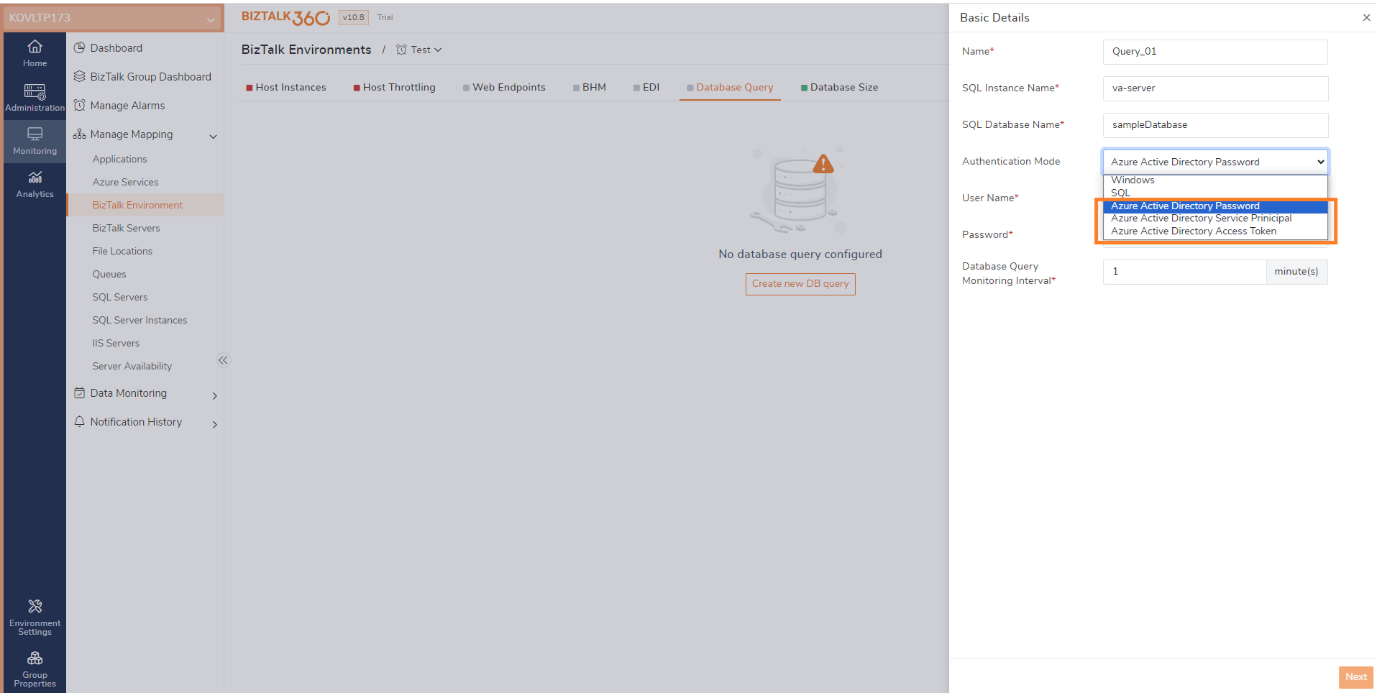
BizTalk360 now has an option that allows users to connect to Azure SQL servers with different authentication options. Users can choose Azure AD authentication options, including Password, Service Principal, and Access Token. This support is made available across the application wherever SQL Queries are used.
In previous versions of BizTalk360, the WMI query has been used to fetch the active nodes. Since it is not efficient in fetching the active SQL Cluster node accurately, SQL query is being used. If at least one active state is set to a cluster service, it checks both the active and passive nodes and starts the active node, which is quite complex.
To make the NT services monitoring more precise, at least one active state is removed; hence, monitoring clustered NT services is carried out only based on the active node.
To set up a clustered SQL Server, enter the SQL Server Network Name instead of the SQL Server name. Choose the instance type as Default or Named; if it’s Named, specify the instance name. Once the Clustered server is added, the system identifies the currently active node. Subsequently, NT service monitoring is carried out, specifically on the active node.
For instance, if you define the desired state of “Service 1” as “Running,” the system promptly verifies whether “Service 1” is currently functioning on the active node. If running, the monitoring status is labeled “Healthy.” Conversely, if “Service 1” is detected as stopped on the active node, the status is promptly updated to “Critical.”
Filtering functionality based on the status of mapped artifacts has been integrated. This has been brought into the grids throughout the monitoring section. Users can now filter grid data based on the monitoring status of the mapped artifacts.
Consider a situation where a user is dealing with a large number of artifacts and needs to investigate those in an error state. In such a scenario, the filtering option based on the monitoring state proves highly beneficial. With a single click, the user can easily filter and focus on artifacts in an error state for further examination.
Also, in the Automated Tasks feature we have released a couple of improvements.
During the automated task creation, the system will verify whether the selected artifacts are already mapped with other alarms for monitoring. If these artifacts are already mapped and they are in conflict, a pop-up will be shown. It shows a message that the selected artifacts have already been mapped to another alarm.
Let us assume that a receive location is mapped for monitoring and set to auto-correct (Enable). If the same artifact is chosen to disable via an automated task, it results in a conflict. In that case, there is a possibility that users might receive false down alerts. To overcome such conflicts, validation is made here.
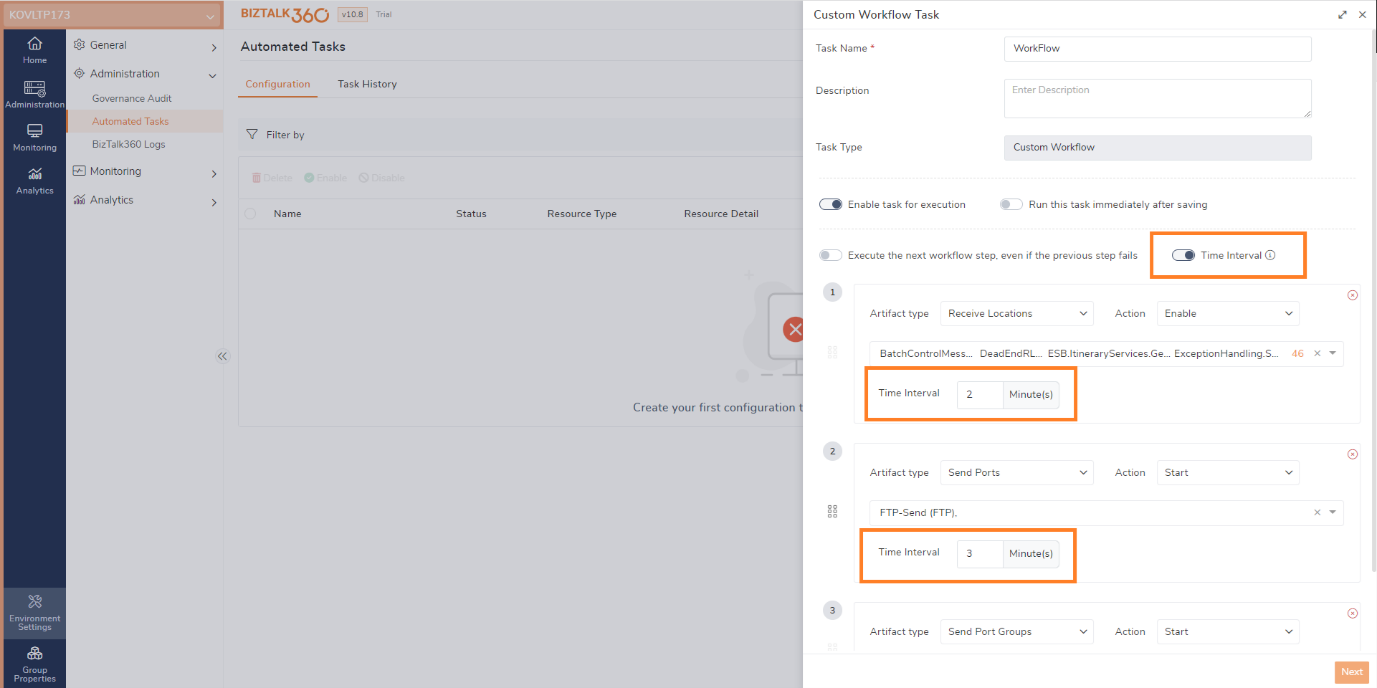
In the Custom workflow automated task, users can define a time interval for execution. For instance, if there are three workflows, setting a 5-minute time interval means that each workflow will be executed after a 5-minute interval.
In a scenario, where an environment is undergoing maintenance from 10:30 to 11:30, it is essential to stop the operation of send ports and receive locations in the user’s environment at 10:30 and start them at 11:30, following the conclusion of the maintenance period. The utilization of a custom workflow automated task facilitates the seamless execution of this process. By configuring the time interval for stopping and starting the ports after one hour.
When BizTalk360 is installed in a high-availability setup, it is important to maintain consistency by upgrading all the services to the same version. If there are any differences found in the versions, it is essential to inform users about this.
To convey this information, the version of the installed services is displayed on both the services page and at the service icon located at the top of the screen.
The Legend names of widgets in the dashboards cannot be changed in the previous versions. There are scenarios where users need to change the EDI parties names on the EDI widgets or users might find it difficult to relate to which BizTalk hosts the performance graph reports on the analytics widget. It might be more user-friendly if the widget’s name is customizable.
There were some requests from users that it would be easier for them if there were an option to customize the legend names of the widgets in the dashboard. Thus, adhering to the user’s feedback this improvement has been made.
Now, users can edit the service name visible in the dashboard layout instead of the default service name mapped. This will allow business users to identify the service name more easily. And it improves the user efficiency.