
Raja Sreenivasan
Author
Published on : Sep 2, 2019
Category : BizTalk360 Update
It’s time to upgrade to the latest version of BizTalk360 V9.0 Phase2. We always aim to improve our product based on customer’s feedback to meet their business needs. This release comes with a handful of most customer asks features and enhancements.
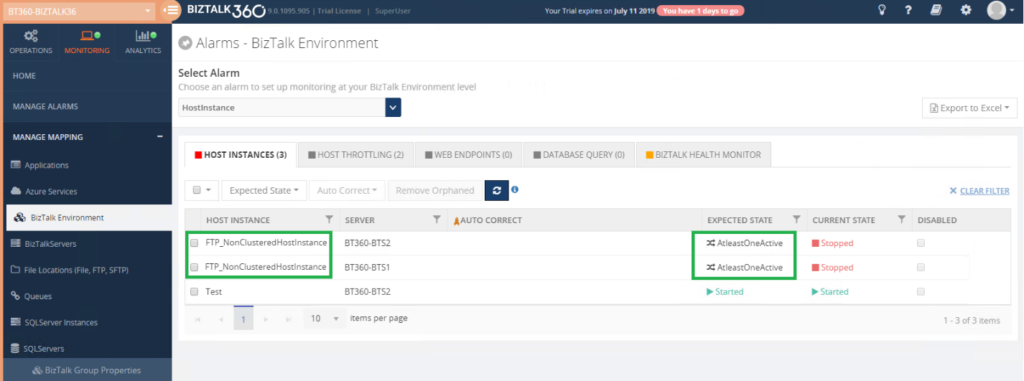
Host Instance Monitoring – This feature is extended to support “AtleastOneActive” monitoring state for Clustered and Non-Cluster Host Instances.
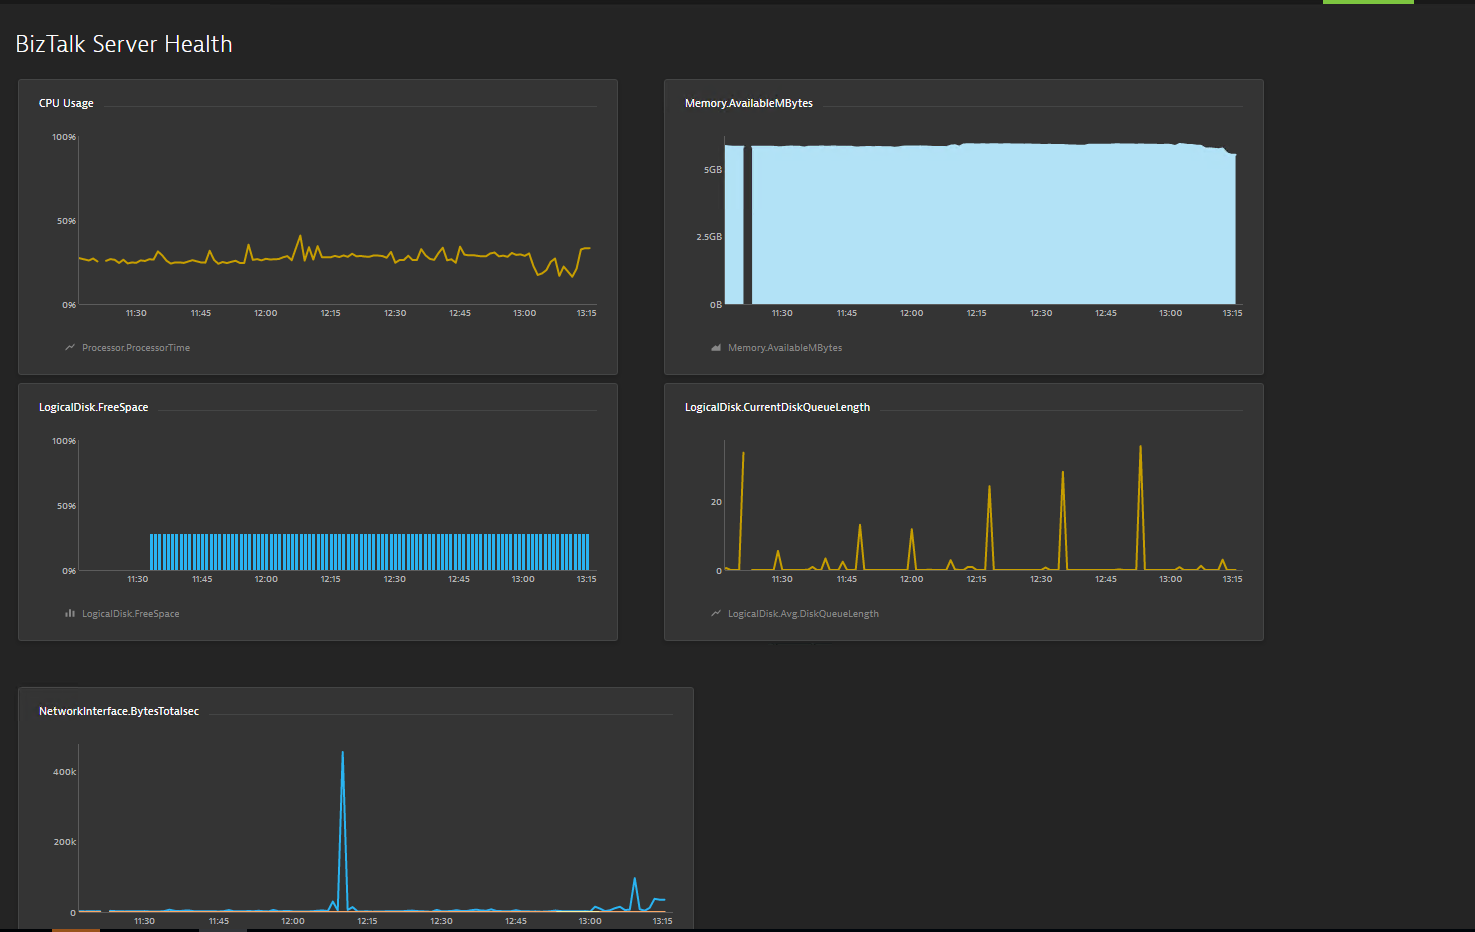
Dynatrace Integration – We have integrated Dynatrace in BizTalk360; with this, you can see the BizTalk Server related performance metrics in Dynatrace.
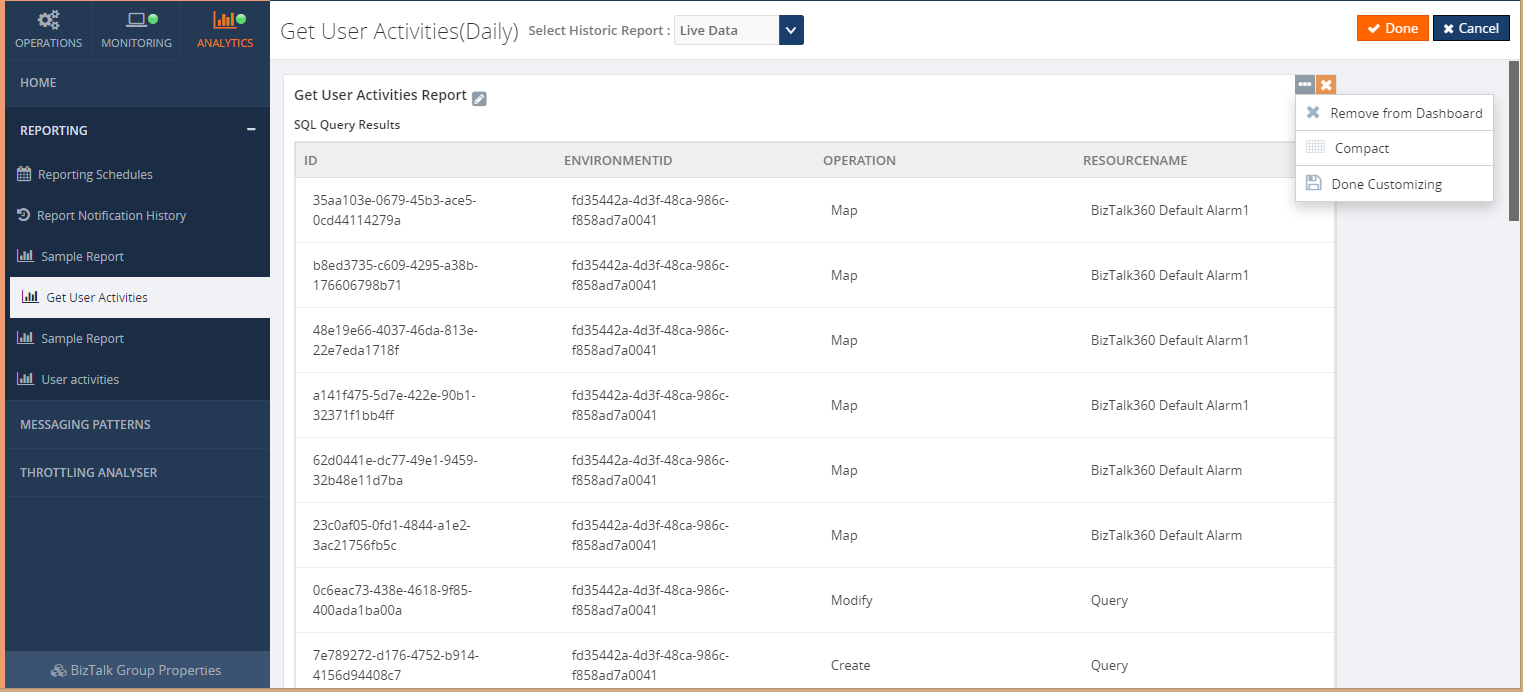
SQL Query Custom Report – In BizTalk Reporting, we introduced an additive widget called Custom SQL Query widget through which SQL queries can be mapped to get the top 100 query result as a report based on the scheduled configuration.
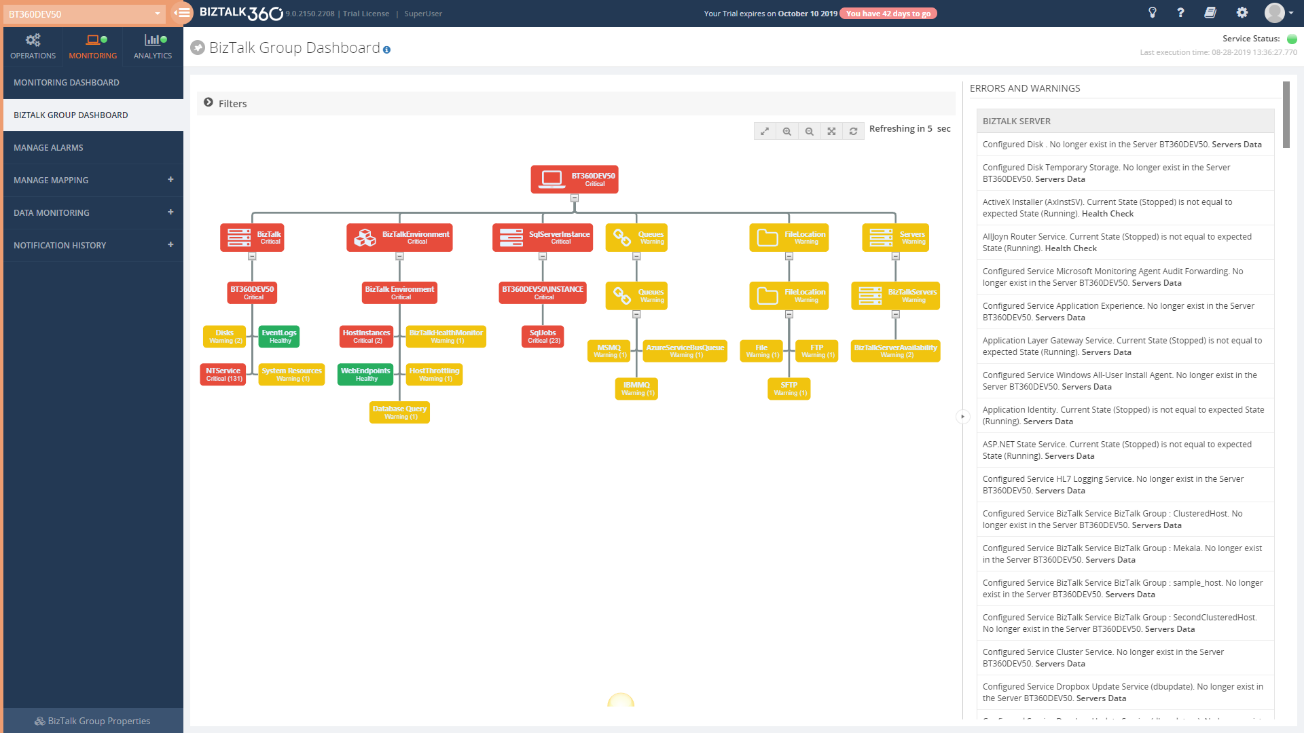
BizTalk Group Dashboard – In BizTalk360’s Monitoring dashboard it was not possible to view the status of all the mapped artifacts in a single view; the user needs to select the alarm each time to view the status of the mapped artifacts of each alarm. To overcome this challenge, we have introduced the BizTalk Group Dashboard which gives a consolidated view of the status of all the artifacts which are mapped to all the alarms in an environment.
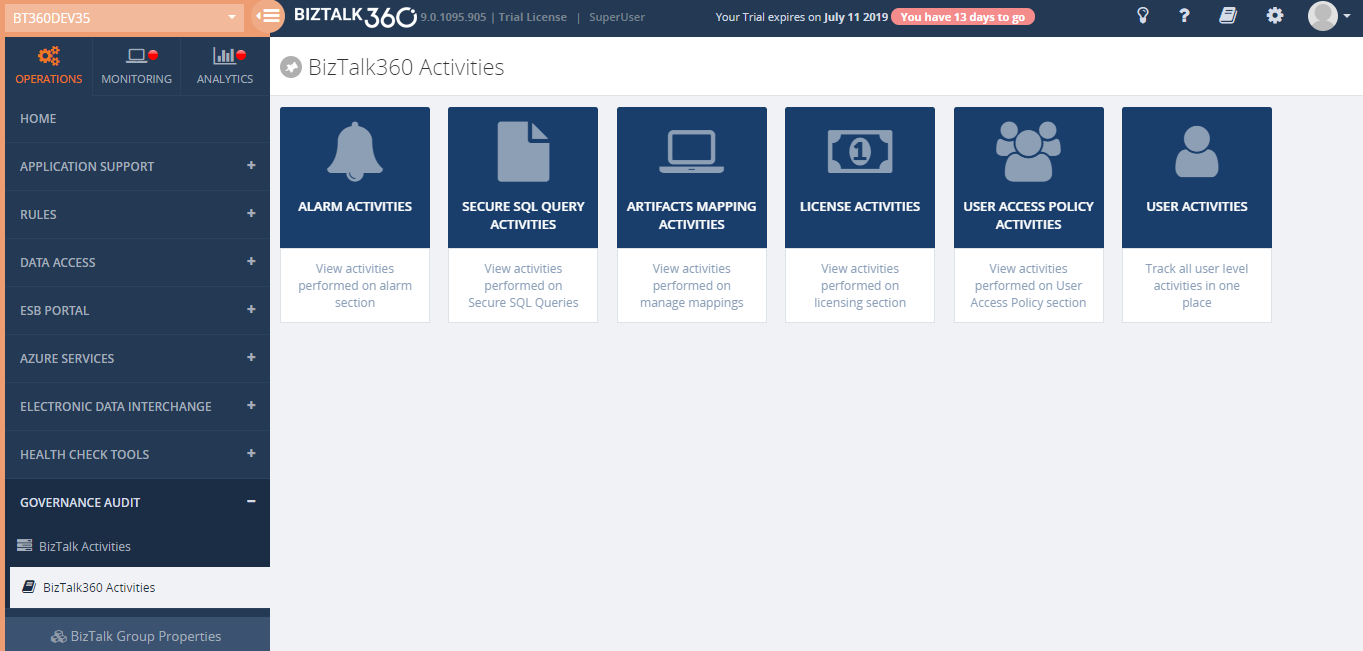
Governance Audit (User Access Policies and License Activities) – BizTalk360 Activities will give a clear view of user actions with respect to Licenses and User Access Policies. License activities include activation, deactivation, remove and manual activation and deactivation. User Access Policy activities will include create, update, delete and import operation under the following section i.e. Manage Users, Manage Application Groups and Manage Custom User profiles
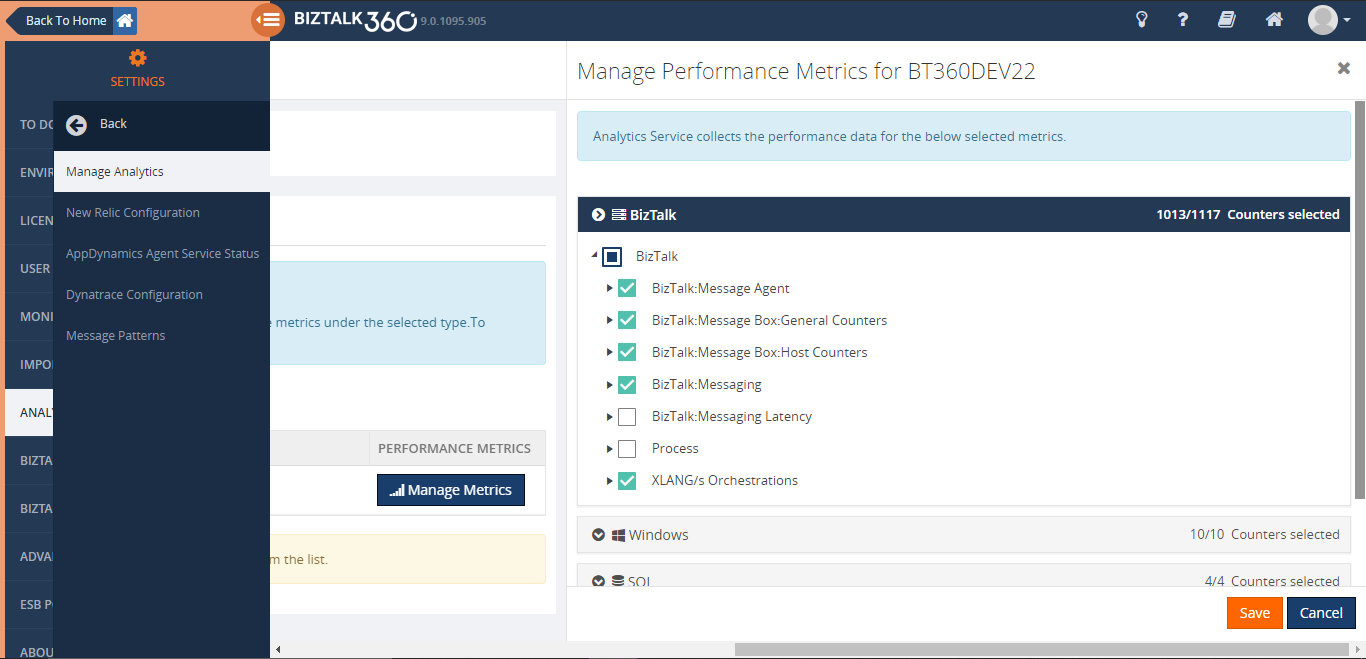
Performance Data Collection Improvements – To improve the performance data collection we are providing an option for the user to select the required performance counters on each type. This way, BizTalk360 will start collecting data only for the selected counters.
Messaging Flow Patterns – Analytics Messaging Flow Patterns can be determined from the BizTalk Management database. Users can switch the Messaging Flow determination technique in the Message Patterns configuration. The Dynamic Pattern option is used to determine the Message Patterns from the tracking database (earlier versions).
A BizTalk Server Host is a logical container that contains the BizTalk Server runtime processes in which you deploy items such as adapter handlers, receive locations (including pipelines), and orchestrations. The host instance is the runtime process where the message processing, receiving, and transmitting occurs. Obviously, it is very important to ensure your host instances are running in your BizTalk environment. BizTalk360 already made it easy, by introducing the Host Instance Monitoring functionality. In BizTalk360, you can monitor the BizTalk Host Instances by setting the Expected State. If the expected state doesn’t match with the current state of the host instance, you will get notified.
Out of the box, BizTalk360 allows users to monitor the Host Instances using the “AtleastOneActive” state.
If this state is assigned as the Expected State, then the monitoring service will verify that across all the instances for the respective clustered host, at least one host instance is active, guaranteeing that the server is running, and no downtime happened for that host/server.
The user can also enable AutoCorrect for Clustered and Non-Clustered host instances monitoring.
Dynatrace is an APM tool which has a generic capability to monitor operating systems, network protocols, system metrics, network infrastructure, applications. By Integrating BizTalk360 with Dynatrace you can view the BizTalk Server performance metrics in your Dynatrace environments; which does not need any agent to be installed in the BizTalk Servers to collect data and it does not require any configuration changes at the server level.
BizTalk360 Analytics Service holds a sub-service for Dynatrace which creates custom metrics in your Dynatrace environment for all the counters which you have enabled in the BizTalk360 Analytics configuration section. Each minute the sub-service will start pushing the collected BizTalk Server performance data to the respective custom metrics. These custom metrics data can be mapped to a custom chart and viewed in your Dynatrace dashboard.
With the Biztalk360 reporting users can generate PDF documents of critical performance metrics and send emails to the user at specific time periods, depending on the requirement in Reporting Section. Now with this version, you can get your SQL query results as a report just by simply mapping the configured secure SQL queries to the reporting schedule. This avoids switching between multiple tools.
Note: BizTalk360 consists of 6 default queries which the user can only execute. In addition to that, you can create new custom SQL queries as per the business need.
Reports can be generated on Daily, Weekly, and Monthly.
Monitoring and Notification is one among the most important feature in BizTalk360.In which user can use the Monitoring dashboard to monitor their BizTalk Environment and get notified if any violation persists. But there is one usability problem exist where user cannot see the consolidated view of all the alarms and their mapped artifact in a single view. To Overcome this, we brought the “BizTalk Group Dashboard”.
The BizTalk Group Dashboard is designed to monitor all the artifacts (and view all errors) which are mapped to all the configured alarms in BizTalk360, in a single view. The “BizTalk Group Dashboard” will automatically pick up all the artifacts (which are mapped to any of the BizTalk360 alarms) and displays the status of the artifacts in a graphical manner. Also, the error/warning details of the displayed artifacts are shown in a grid view. The BizTalk Group dashboard checks the status of the artifacts in every 60 seconds.
In addition to BizTalk360 auditing Activities, now user can audit the user Access policies and license activities details in BizTalk360 activities.
In License auditing, users will be able to see the activities like License Activation, Deactivation and Removal of licenses, along with the details like Environment name, Product License Type, Environment Type, Order number, License code, License edition, and Max BizTalk servers.
In User Access Policy auditing, BizTalk360 captures the activities like,
Below are some of the major improvements we have done in this release
In earlier versions, user can enable the performance data collection for the various server types, say BizTalk, SQL, IIS, Windows, where BizTalk360 will start collecting performance data for all the counters of the selected type. From this version on, to improve the performance, we are providing an option for the user to select the required performance counters on each type. This way, BizTalk360 will start collecting data only for the selected counters.
By using “Manage Metrics” option user can manage the performance metrics data collection for each server in the configured. User can choose what type of data they want in the environment level from the neat tree view diagram. Based on the selection analytics service collects the performance data which avoids performance impact.
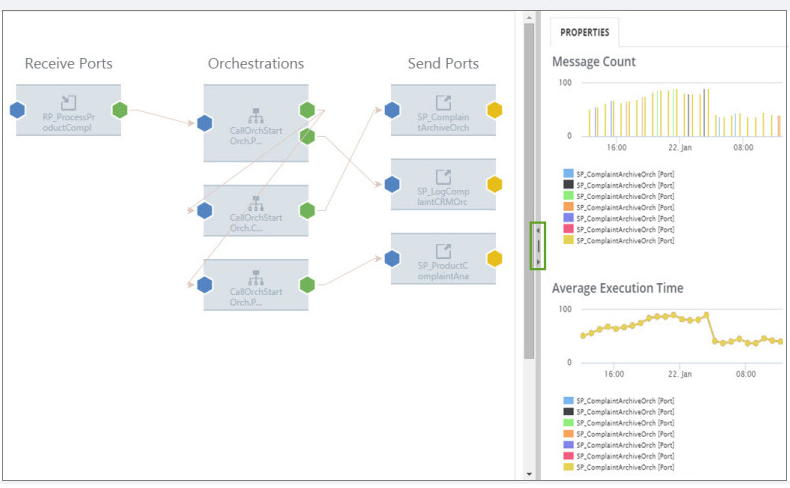
In complex BizTalk environment, it is important to visualize the patterns of how messages are processed within the system or integrate with multiple disparate systems to handle the message transfer from one point to another. It could be a simple direct transfer between the two ports, or through a complex messaging route passing through orchestrations to perform certain validations, etc. It is helpful to BizTalk Administrators or Business users to track the flow of messages in different stages. For this purpose, the BizTalk Admin Console has the capability to view the workflow of messages, although that feature will mainly be of use for BizTalk Administrators.
we are bringing management capabilities like hiding and deleting of message flows.
The Hide Operation can be used on the message patterns that are decommissioned or less frequently used. The Delete Operation can be applied on the flows that are no longer used in BizTalk Group.
BizTalk360 now supports AE5 cryptography algorithm to support FIPS Compliance in Encryption/Decryption mechanism.
BizTalk Server can support both case sensitive and case insensitive collation. To make BizTalk360 more compatible with BizTalk Server, we have improved BizTalk360 in such a way that it will support case sensitive collation as well.
The rules created using .NET classes with BRE pipeline framework are getting displayed in BizTalk360
In ESB Exception user can provide the Action Type and Comments while deleting the faults, the same will be audited for reference. Also when the message is edited before resubmit then it will be audited as ‘resubmit with data modification’.
Besides these new features and enhancements, we have fixed a few bugs. Refer release notes for more information.
Considering the feedback from our customers, BizTalk360 will continue to provide more useful features. Why not give BizTalk360 a try! It takes only 10 minutes to install on your BizTalk environments and you can witness and check the security and productivity of your own BizTalk Environments.