
Praveena
Author
Published on : Sep 2, 2021
Category : BizTalk360 Update
BizTalk360 is getting a fresh look. Yes! It’s time for a major upgrade. BizTalk360 v10 is the next major release coming up after v8.0 where the UI was completely revamped for a better user experience. Every release of BizTalk360 comes up with a hand full of new features and enhancements. But v10 is a little different. This blog article gives a complete picture of what v10 has come up with.
Each feature in BizTalk360 has its own make over in this new version. As you all are aware monitoring is the core functionality of the product. But when it comes to servers, performance plays a major role. It would be more helpful when such information is represented in graphs rather than simply shown in numbers. It is for this reason that the Analytics module was added to BizTalk360 in v8.0. After this, there have been a lot of features added to this section. Now, the Analytics section is even friendlier in v10. Let us check out the new look of the Analytics section.
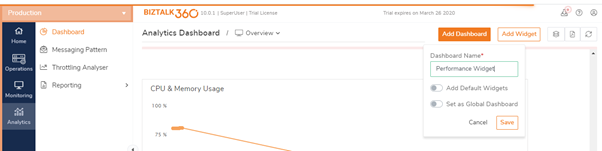
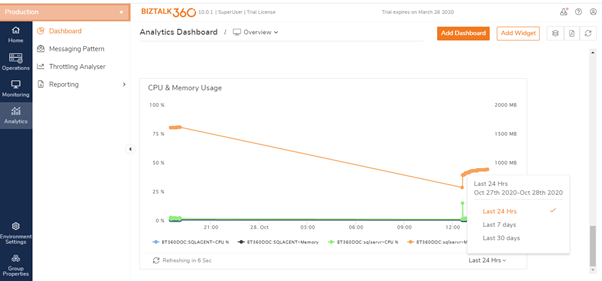
The Analytics dashboard gives the details of the performance information in a nice graphical manner. With the data in the widgets, the performance details of the BizTalk server, BizTalk hosts and the SQL servers are shown. This will help the system admins and the DBA to check for any issues and take corrective actions when, for example, the CPU spikes up or the memory usage increases. In v10, the below is the new look of the dashboard.
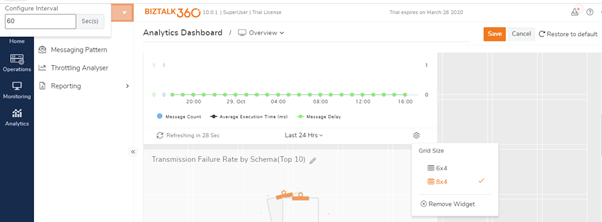
In previous versions, the datetime range would be shown next to the widget name. Now, for a better user experience, we have grouped the datetime ranges to a separate section. There is also additional information regarding date range. For example, when the range is selected as last 24 hrs, we can see the date shown as Oct 27th to Oct 28th. This will give clear information to the customer as to what data is being collected. This would also make it easier to switch between the time ranges and check for the actual data.
The options to add new dashboards is even easier than in the previous versions. In earlier versions, a separate page was opened where the dashboard name can be entered. In the latest version, you can provide the dashboard name in the same page, making it very user friendly.
There would be a situation where the users would like to create specific dashboards as per their requirement. So, when a dashboard has been created, enabling the ‘Set as Global Dashboard’ option will make the dashboard visible to all the other users who login to BizTalk360. Disabling it will make the dashboard visible only to that specific user.
The other options like adding widgets and custom widgets remain the same.
The customize option is present in the dashboard, this helps the user to resize the widgets as per the screen resolution. This helps users to check for the data view and set the resolution as per the requirement.
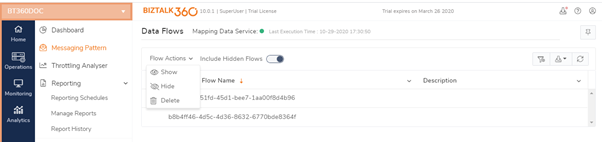
Messaging pattern is yet another interesting feature, which represents the message flow of the BizTalk applications. This flow represents the unique pattern available for each application. The message count and the average execution time of the message transmission are represented along with the message flow details.
In the latest version, the graphical representation has been improved to give a clear view of the message flow. The message count information was initially taken from the tracking database BizTalkDTADb which needs tracking to be enabled. This may affect the performance of the BizTalk server when more tracking needs to be enabled. This has been a pain point for multiple customers. Considering this feedback, we have enhanced the data collection to fetch the details directly from the MessageBoxDb. This helps in enhancing the performance of the server, since there is no tracking required to be enabled.
Several flow action options are present to perform operations on the flows such as show, hide and delete. The hidden flows can be made visible by enabling the Include hidden flows option.
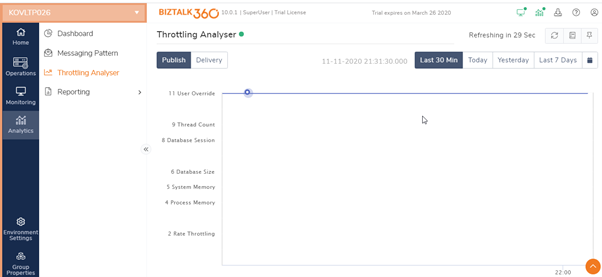
At times there may arise a situation where a BizTalk host throttles due to lack of system resources or other reasons. It would be difficult for the users to find out if throttling had happened or not and what is the root cause of the throttling. This can be easily viewed in BizTalk360 with a clear graphical view. The reason of throttling will also be displayed so that it can be easy for the users to understand the cause for the throttling and take necessary actions accordingly.
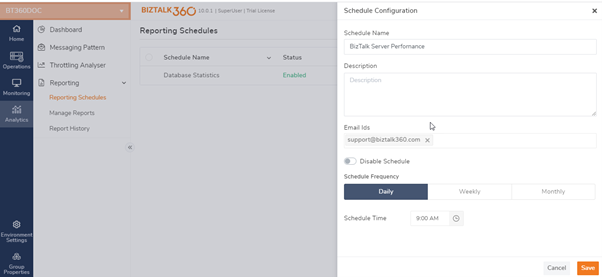
The Reporting feature is one of the widely used features because it gives the reports of the performance details in an email. The reporting schedule creation and addition of the widgets is made easy in the latest version. All the schedule configuration can be done in a single page instead of moving to different pages as in earlier versions.
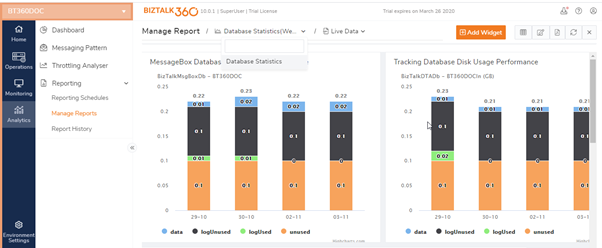
The adding of the reporting widgets is easier now. The options are clear and with a single drop down you can select the widgets and the historical data.
The performance has been enhanced a lot with these options, as every single option is available in a single page and the user need not switch between the pages for configuring the schedules and the options. Such a design is the need of the hour for any software product as speedy access is one of the main qualities seen in any software product. With a huge bunch of features available within it, BizTalk360 aims at providing better performance to its users. Every single option in a screen is designed in this way.
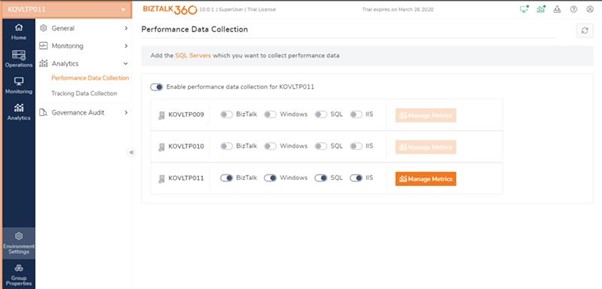
For collecting the Analytics data and displaying it in the widgets, some configurations must be done in the Analytics section. To view the performance data and the tracking data, the corresponding counters need to be collected.

The UI looks more friendly now and it is very easy to select the counters for which you want to view the data in the Analytics widgets.
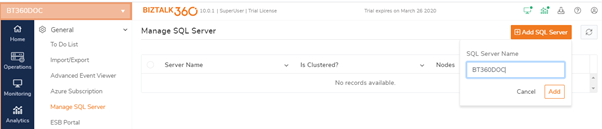
In the previous versions, there would be a separate option to add the SQL servers in order to view the performance data of the SQL servers.
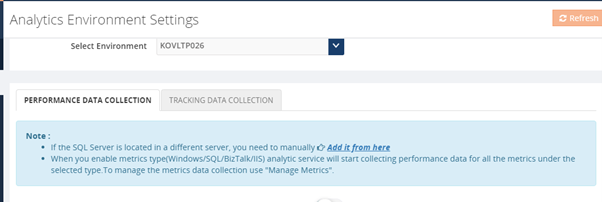
This is not available in the latest version. The SQL server details would be taken when you add the SQL servers for monitoring and the redundancy is avoided.
Bringing a new look to the UI will give a new experience and better performance for any product. As the time changes, the expectations also change, and any product should meet these expectations. We at BizTalk360, constantly get the customer feedback and develop the features based on the feedback and the suggestions. Why not give a try to our new BizTalk360? Be ready to download and try the new version. Happy monitoring!