vishnub
Author
Published on : Dec 22, 2016
Category : BizTalk360 Update
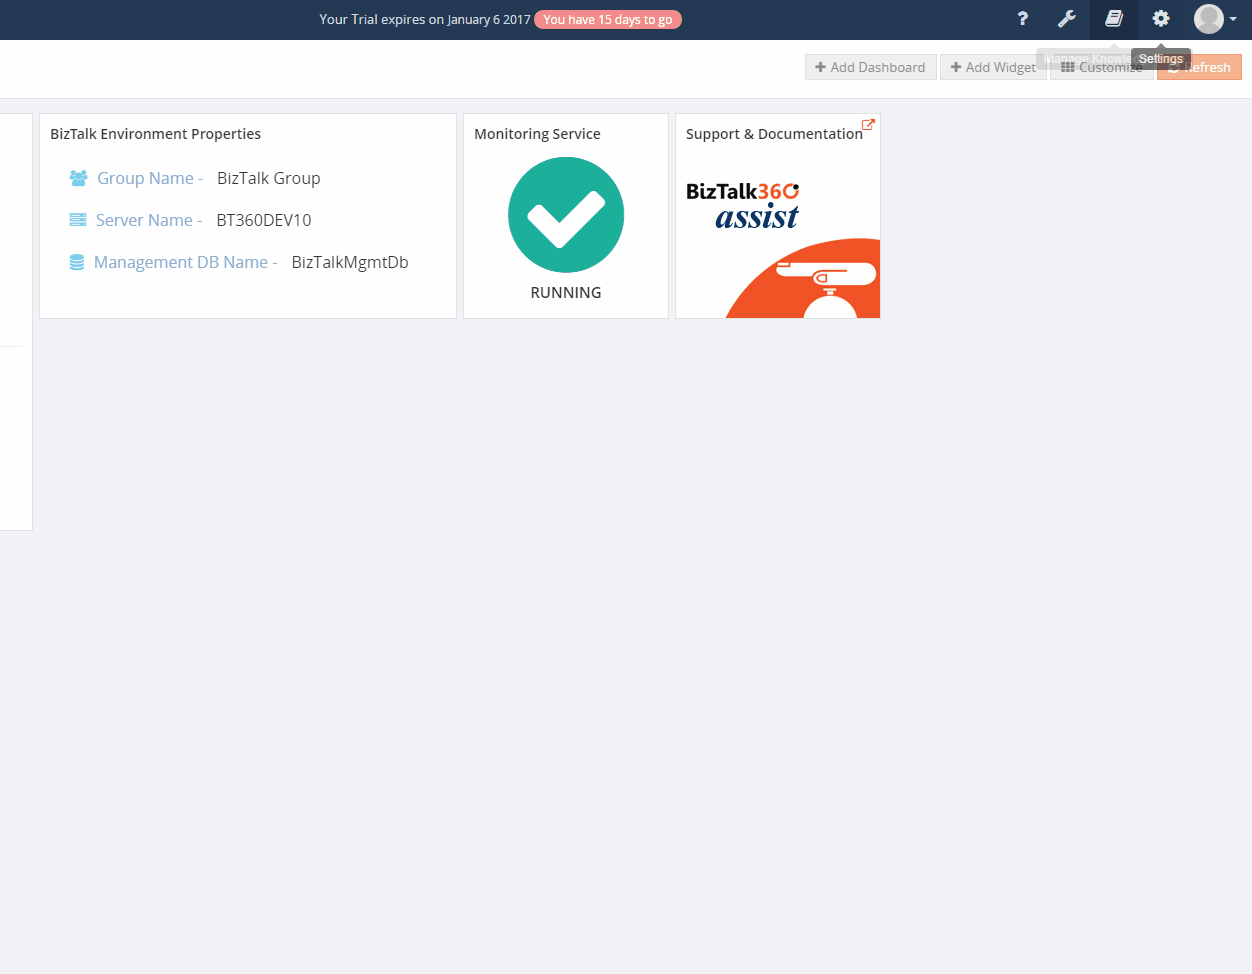
BizTalk360 Version 8.0 was a major milestone release for BizTalk360. It was a complete overhaul of the product and introduced features like widget based dashboards and Analytics capabilities. From an end user standpoint, dashboard is perhaps the biggest feature they got in 8.0 loaded with customizable information and a variety of widgets to choose from. In a nutshell, it almost reminded us of the new Azure Portal. One small but powerful feature offered by Operations Dashboard is the ability to author custom widgets.
BizTalk360 Custom Widget is like a “plain canvas” and its potential is left to the user’s imagination.
With the BizTalk360 custom widget option, users can create widgets that can be integrated with any third party application like SalesForce, etc., as long as you have a working and accessible API.
Senthil Palanisamy, our Technical Lead at BizTalk360 wrote an interesting article on custom widgets, in which he talks about creating a custom widget that monitors the status of SQL jobs using BizTalk360 APIs. He also covers advanced topics like Place Holders and how to leverage BizTalk360 API documentation to create Custom Widgets.
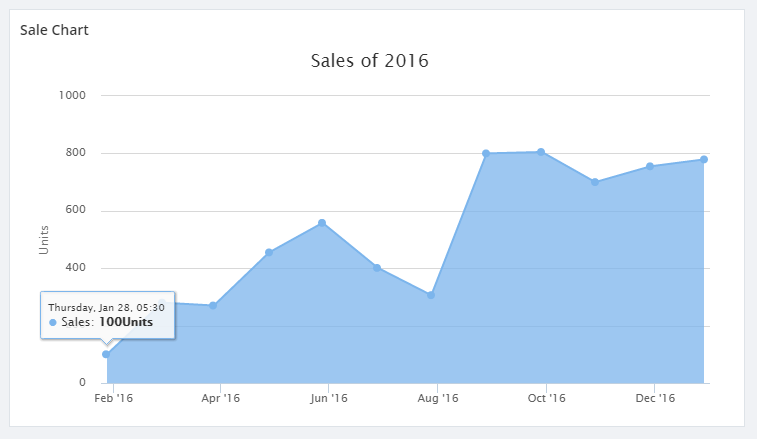
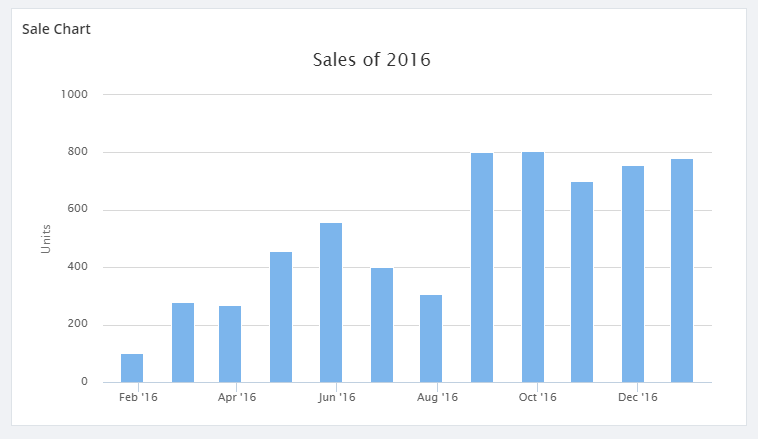
In this article, I will show how to create a BizTalk360 custom widget that can show analytical data in graphical form.Let’s take the sales figures of XYZ company for example and see how we can create a BizTalk360 Custom Widget that projects the sales figures in graphical form. You will need an API that returns the number of units sold in a year for each month. I have a sample API hosted in GitHub that returns JSON data which we are going to use here. The first step is to create the custom widget.
<script>
//URL used to get JSON Data for the Charts
this.URL = 'http://rawgit.com/cyberkingvb/CustomWidgetWithChart/master/sales2016.json';

//Refresh interval in milliseconds 60000 milliseconds = 60 seconds
this.REFRESH_INTERVAL = 60000;

//flag to check if widget should auto Refresh
this.AUTO_REFRESH_ENABLED = true;

//Highcharts Options
this.HIGHCHART_OPTIONS = {
            chart: {
                type: 'line',
                zoomType: 'x'
            },
            exporting: {
                enabled: false
            },
            credits: {
                enabled: false,
                title: '',
                style: {
                    display: 'none'
                }
            },
            title: {
                text: 'Sales of 2016'
            },
            xAxis: {
                type: 'datetime'
            },
            yAxis: {
                min:0,
                title: {
                text: 'Units'
                },
            },
            tooltip: {
                crosshairs: true,
                shared: true,
                valueSuffix: 'Units'
            },
            legend: {
                enabled: false
            },
            series: [{
                name: 'Sales',
                data: []
            }]
        };

this.widgetDetails = ko.observable();
this.error = ko.observable(null);
var _this = this;
var getdata = function()
    {
$.getJSON(_this.URL, function (data)
    		{
      		    _this.HIGHCHART_OPTIONS.series[0].data = data;
    		    _this.widgetDetails(_this.HIGHCHART_OPTIONS);
		    _this.error(null);
    		}).fail(function(errorObject,error)
			{
	console.log(errorObject);
	_this.error(errorObject);
});
    }

//loading data for the first time
getdata();

//handles auto refresh
if(this.AUTO_REFRESH_ENABLED)
	setInterval(getdata, this.REFRESH_INTERVAL);

</script>

<!-- ko if: error() == null -->
<div data-bind="highCharts: widgetDetails()" style="height:380px; width:700px"></div>
<!-- /ko -->

<!-- ko if: error() != null -->
<div class="row">
  <div class="col-md-offset-4 col-md-4 bg-danger">
    <b>
      <p>Error occured while trying to fetch data </p>
        <span>Status : </span><span data-bind="text:error().status"></span><br>
      <span>Status Text : </span><span data-bind="text:error().statusText"></span>
    </b>
</div>
</div>
<!-- /ko -->
For simplicity, the use of knockout has been minimized and most is done using basic JavaScript. If you notice in the beginning of the code, there are 4 configuration variables used.
URL variable lets you configure the API URL from where you fetch the JSON data. Based on the Highcharts options, the formatting for the data may also change. Here in this example, the API returns the data as JSON array, and date-time stamp as a Unix Timestamp.
Example:[ [1453939200, 1.1], [1456617600, 1.8], ……………… ……………… ]
This flag determines if your widget should be auto refreshed or not. For instance, if the service call that feeds your chart is very expensive and you don’t want to call that every now and then, then you can probably disable this flag or set the refresh interval to a higher value.
Refresh interval lets you configure the interval after which the widget data should be refreshed. Note that the interval is in milliseconds so if you want it to refresh every one minute then you should set the refresh interval to 60000. Note that for auto refresh to work, IS AUTO_REFRESH_ENABLED flag must be set to true.
BizTalk360 uses Highcharts for all data analytics. We already have the underlying binding handler framework to apply your chart options, and this makes analytic widget creation a lot easier. To modify the charts, you simply need to update the HIGHCHART_OPTIONS. In this example,
series: [{
            name: 'Sales',
            data: []
}]
the “data” property inside series array (where the data is supposed to be) is left as an empty array intentionally. It will be filled with the data that is retrieved from the URL that you have specified. Highcharts supports a variety of charts and you can follow this link to get the type of chart that you want to bring into your custom widget.
The line chart that we have created here can be converted into an Area chart or a Column chart by simply changing “type” under “charts” options in HIGHCHART_OPTIONS.
 Basic error handing is also done for you, in case of error in accessing API, error info will be displayed along with return code.