Rachit Sikroria
Author
Published on : Jan 26, 2017
Category : BizTalk Server Support
A quick and complete dashboard of a BizTalk group which will help BizTalk administrators monitor the health of the BizTalk platform. The standalone version of BHM can be downloaded from Microsoft Download Center here: BizTalk Health Monitor.
After downloading and unzipping the BHM.ZIP file from the Microsoft Download Center, use the “InstallUtil.exe” which comes with BizTalk Health Monitor tool to register the BHM snap in.
Important: Unzip the BHM.ZIP to a final destination before you register the snap-in for example: C:\Program Files (x86)\Microsoft BizTalk Server 2010\SDK\Utilities\BHM. Once you register the BizTalk Health Monitor Snap-In you cannot delete the folder or BHM will stop working
To accomplished that we need to:
BHM Snap-In can be used independently and need not to be integrated with BizTalk Administration Console. The handicap of this approach is that a BizTalk Administration will need to use two different places/tools to monitor and administrate the environment.
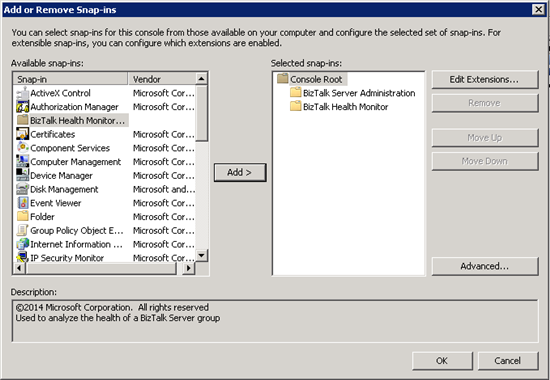
To be easier and more convenience for BizTalk Administrators BHM Snap-In can also be integrate it so that it can be used with BizTalk Administration Console.
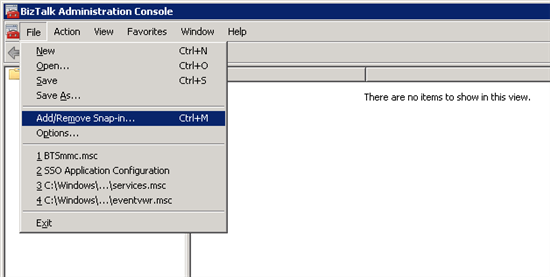
To accomplished that we need to open a 32-bit Microsoft Management Console (MMC):
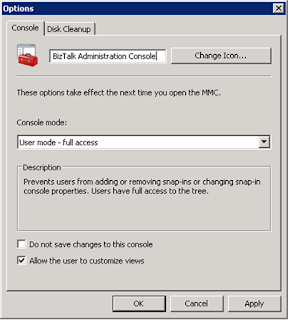
Now to save this as a new .msc file so that you don’t have to repeat these steps again but before we complete the creation process of the “new” BizTalk Administration Console, I recommend that you navigate to the BizTalk Server Installation folder:
This because we will save the “new” BizTalk Administration Console as “BTSmmc.msc” so that you don’t need to create new shortcuts or having different ways to access the BizTalk Administration Console – however this step is optional!
To finished the creation process of the “new” BizTalk Administration Console
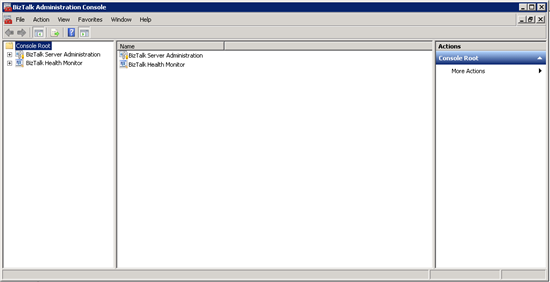
From next time onwards, when you open the BizTalk Server Administration Console the “new” BizTalk Administration Console will be incorporated with the BizTalk Health Monitor
1.) Generate and View MBV report
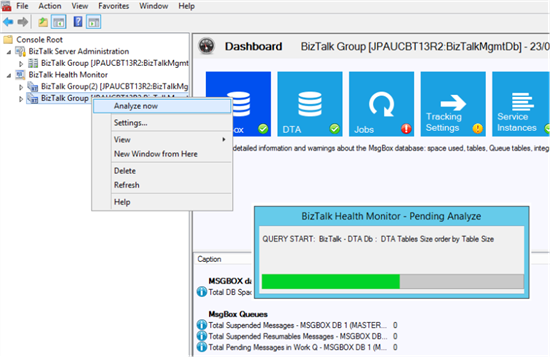
Once a group node is added in the BHM hierarchy, you can start immediately to analyze its corresponding BizTalk group by right-clicking on the node and select the “Analyze now” menu item.
The analysis consists of running a number of queries to collect all important information of the BizTalk group, evaluating a set of rules for each of them, and raising any warnings (critical or not) if there is any.
Each time an analysis process is completed, a child node report is added in the group node. Each child report has further sub-nodes to present the collected information:
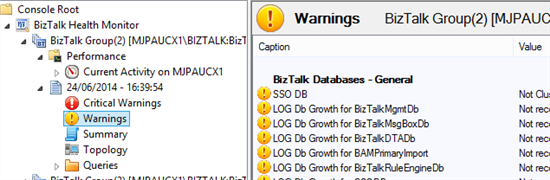
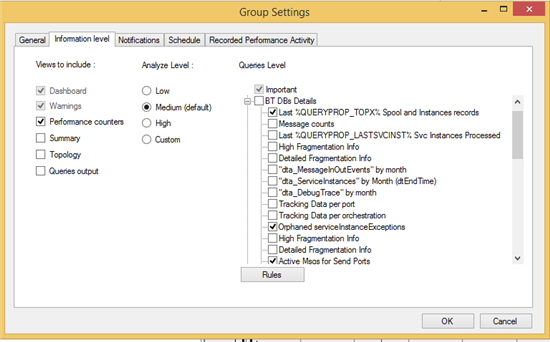
This sub-nodes list details depends on the level of information you selected to display in BHM. The property page Information level of the group node settings allows you to select which sub-nodes you want to display for each generated report, and the level of information to collect during the analysis process (as shown below). The more queries you select to include in the analysis, the more information and potentially more warnings BHM will raise.
You can so customize as you want the level of information to analyse and display in BHM for each added group node.
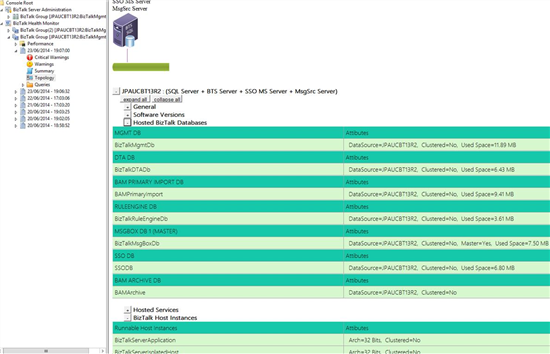
This is for example the output of the Topology sub-node:
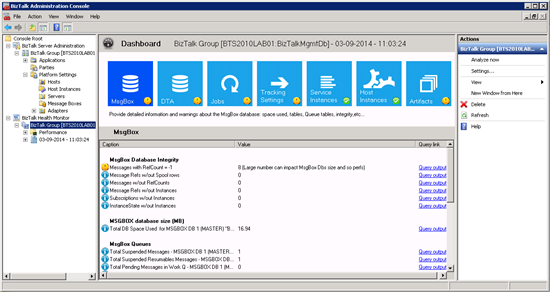
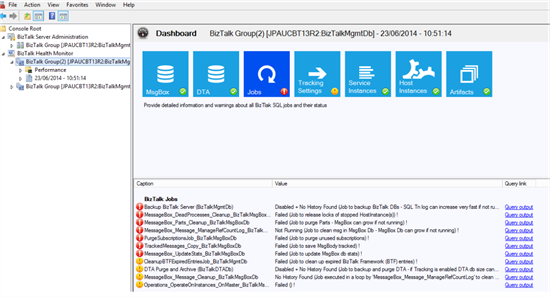
2.) Dashboard view for the overall health of BizTalk Environment
The output of the “Analyze Now” action will also generate a dashboard (as shown below) presenting a quick summary all the information you need to know about the BizTalk platform. We have categorized the information under different tiles as their names suggest. Each tile will be presented with a small icon on the bottom right of the tile which represents the overall health of that category. A green right mark shows that this category is healthy. A yellow exclamation sign represents some non-critical warnings whereas a red exclamation represents some critical warnings which need immediate attention. You can click on these tiles to get additional details on the lower pane.
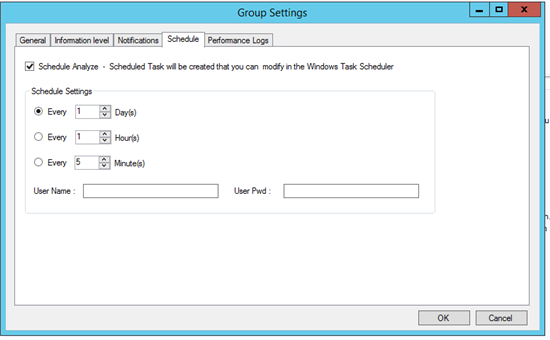
3.) Schedule Report collection
A BizTalk platform processing messages 24×7 needs to be monitored at least daily. BHM provides you a way to create a scheduled task to automate a periodic collection of BHM report.
The property page Schedule of the group node settings provides an option to enable a scheduled analyze. This schedule task can be of course modified then in the Windows Task Scheduler.
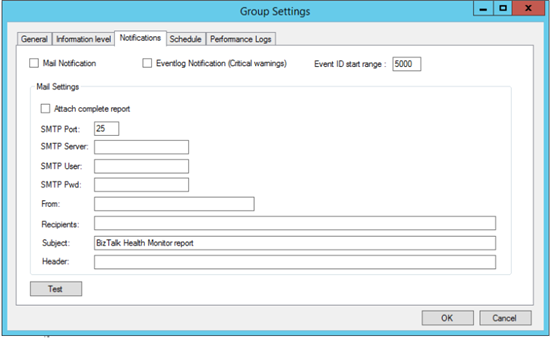
4.) Send Email Notifications
Receiving by mail the list of warning that MBV generates is a feature that has been demanded by lot of MBV users. We have incorporated this feature in BHM where you have an option to send the dashboard and the list of warnings to an email address after a fresh analysis.
BHM provides so an option to send automatically by mail the dashboard and the list of warnings after a fresh analysis. You can enable and configure this feature from the property page of the group node settings (select the “Settings” menu item when right clicking on a group node). An email will also be sent each time if you have scheduled the BHM report collection.
We have also provided a Test button which you can use to test the SMTP settings you have entered. It will send a test email to make sure that SMPT settings are correct.
5.) Perfmon integration with pre-loaded scenario based Performance counters
BizTalk provides a large number of performance counters to monitor like the state of the BizTalk databases, the BizTalk queues, the messaging and XLANG performances, the throttling states, the adapters performances etc…There are various such counters available but they are less known and visible to the BizTalk administrators.
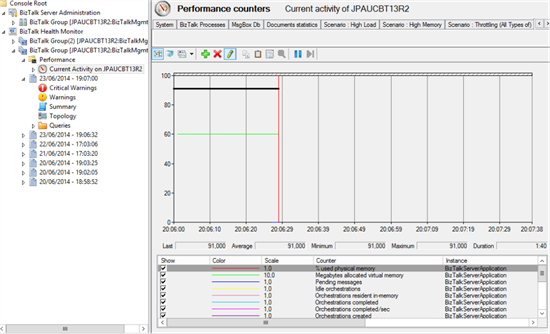
BHM directly integrates Perfmon tool in its own MMC which provides a quick and easy way to monitor these counters. Furthermore, for each group node, BHM provides you a list of predefined views with pre-selected counters that you can quickly display at any time.
BHM will let you display either the current activity of the monitored BizTalk platform, or a recorded performance activity.
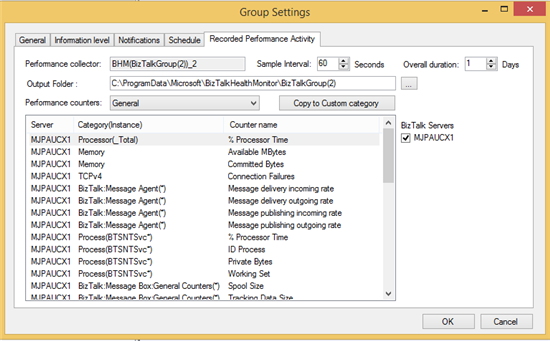
BHM can also automate the recording of a perfmon activity for a given period. You can enable and configure this feature from the property page Recorded Performance activity of the group node settings (as show below).
BHM provides you a set of pre-defined scenarios with selected performance counters and you can choose the preferred scenario. You can also add your own counters if you chose the custom scenario option. The property page allows you to configure the sample interval and the duration of the recorded activity.
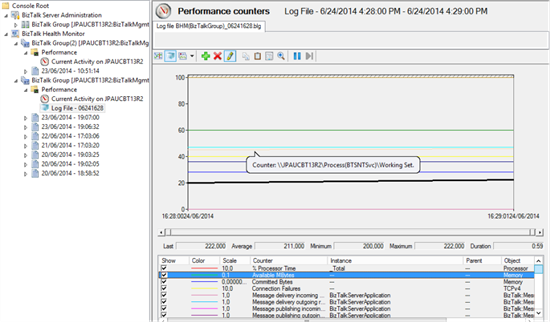
Once the recorded activity is configured, BHM can automate the creation, the start & stop of a performance log file corresponding to the selected scenario. When the recorded activity is completed, you can display it inside BHM by selecting the corresponding sub-node (as show below).
6.) Custom queries
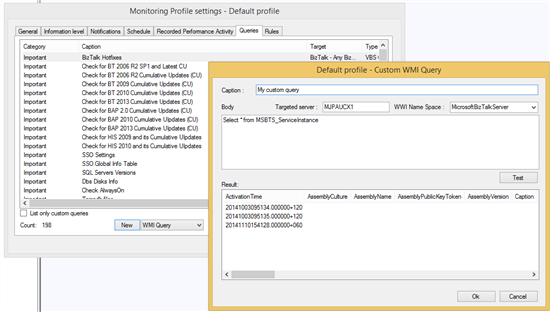
BHM repository has a collection of almost 200 queries and now with v2 you have an option to build and add your own queries to this repository. The type of a custom query you can add are:
Once a custom query is added in a profile, it will be saved in that profile and visible in the query tree view of the “Information Level” of the profile settings and can be checked or unchecked, like any native queries of BHM. And like any native BHM queries, a custom query can be pinned to a dashboard.
To add a custom query:
You can of course edit or remove custom queries
Notes:
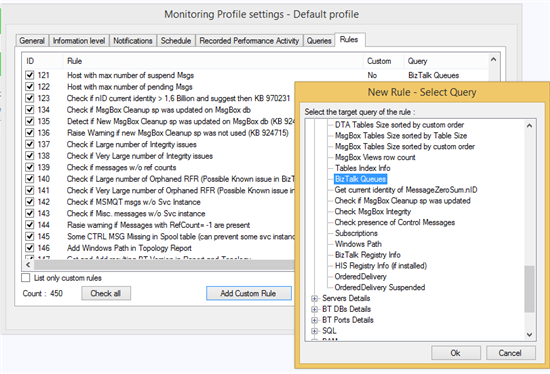
7.) Custom Rules
BHM engine has a repository of rules which are applied on its queries and are displayed in the report accordingly. Out of the box BHM comes up with around 450 rules which does various kind of checks on your BizTalk environment. And if that’s not enough BHM v2 will give you an option to write your own custom rules on existing or custom queries.
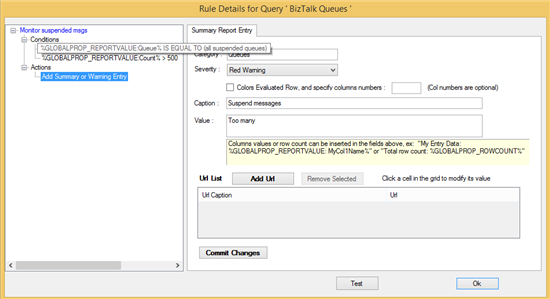
A Rule in BHM is a set of conditions (AND between the conditions) checking each row of a query output, and a set of triggered actions if all the conditions are validated. Each rule target a query and will be executed at the end of the query execution, parsing each row of the query output to validate the conditions.
A condition is composed of two fields to compare using a predicate. One field represent the column value to check for the current parsed row and the other field is the value to compare with. The predicate can be selected among a given list. You can add as many conditions as you want, and if all the conditions are validated for a parsed row then the rule will trigger some actions.
You can create three types of action:
Follow this to add a rule:
You can of course edit or remove custom rules
Notes:
MBV engine used by BHM allows to create complex rules in custom assemblies but this feature is not yet exposed in BHM.
Here, you’ll find several BizTalk monitoring tools for administering and monitoring your BizTalk Server environment that still exist in the current market.