BizTalk360 already has the capability to integrate with New Relic, in which user can get insights on real-time performance data .
Application Performance Management or Application Performance Monitoring (APM) is an essential tool to help managing and monitoring the performance of an application.In today’s market a wide range of tools is available to optimize and monitor the performance of an application. AppDynamics is a well-known top application performance monitoring tool when it comes to APM. Knowing the importance of Application Performance Monitoring, BizTalk360 provides integration with AppDynamics from the v8.9.6.
For large organizations spend quite good investment when comes for complex network for optimization and monitor the performance of apps and related issues.AppDynamics is widely used by companies as an enterprise-wide monitoring solution and it has the capability to provide deep performance analytics of your configured environment .Considering the importance of monitoring the performance of BizTalk Server environment in a single place, few of our customer requested us to integrate AppDynamics in BizTalk360.
If you are already using AppDynamics, you can view the performance metrics of the BizTalk server environment across multiple widgets in AppDynamics dashboard from the BizTalk360 v8.9.6.
Initially, BizTalk360 will provide capabilities to push BizTalk Server Analytics information to the AppDynamics. Some of the important BizTalk environment performance metrics categories are
All metrics have different counters, which are constantly being collected and pushed over to the AppDynamics Controller.
BizTalk Server Health Metrics has
Message Performance
Host Performance
Throttling Performance
Every monitoring tool has a different core architecture. When looking on the surface, they might look similar, but when we look in detail of it, it becomes clear how different all the monitoring tools works.
AppDynamics supports different development languages, while we are using .NET because BizTalk360 is build on top of .NET framework.
AppDynamics provides a piece of software called Agent which is installed on the server to which application needs to be monitored. The Agent collects metrics and sends them to a server called the Controller. The controller processes the metrics and presents them via Web Browser.
The BizTalk360 Analytics service includes a sub-service called “AppDynamics” which is responsible to constantly push BizTalk Server performance data to Agent. The AppDynamics sub service executes every 70 seconds and checks for the data in the performance data service(another BizTalk360 Analytical sub service). The Controller, which processes the data, makes the data available through a web browser to the user.
BizTalk360 collects the BizTalk Server Analytical data and the AppDynamics agent constantly picks up these data with the help of Windows performance counter data and sends it over to the controller. In AppDynamics, this data is available under the custom metric in the Metrics browser of each application.
For configuring the AppDynamics agent, you need to download and install the .NET Agent (32/64 bit) in the Application server (where the BizTalk360 Analytics Service is running) . Once the installation is successful, the .NET agent creates the coordinator service and configuration file which consists of the controller and application details.
The default location of the machine agent configuration file is located at:
For Windows Server 2008 or later: %ProgramData%\AppDynamics\DotNetAgent
BizTalk360 collects all the BizTalk Server analytical data assigns it to Windows performance counters, and updates the performance counters in the AppDynamics config file as below .
The data will be collected by the .NET Agent coordinator service and passes it to the respective controller as custom metric mentioned in the agent configuration file.
To get the latest performance metrics/counters user need to restart BizTalk360 Analytics service, by doing this the new counters will be updated in AppDynamic config file. Agent then collects the newly introduced performance counter values and start updating in the respective application metric browser configured in AppDynamics.
Once the AppDynamics agent coordinator service starts pushing data, all the metrics will be available under the metric browser of the respective application in AppDynamics.
To maximize the uptime of the BizTalk Server solution it is important to monitor the availability of BizTalk Server environment. By enabling the performance counter in Analytics section, the BizTalk360 Analytics service will start to push data to AppDynamics with the help of the Agent coordinator. All the data are segregated based on server name and their corresponding metrics and counters.

You can configure and manage multiple BizTalk environments in BizTalk360. For adding multiple BizTalk Environments please refer this link.
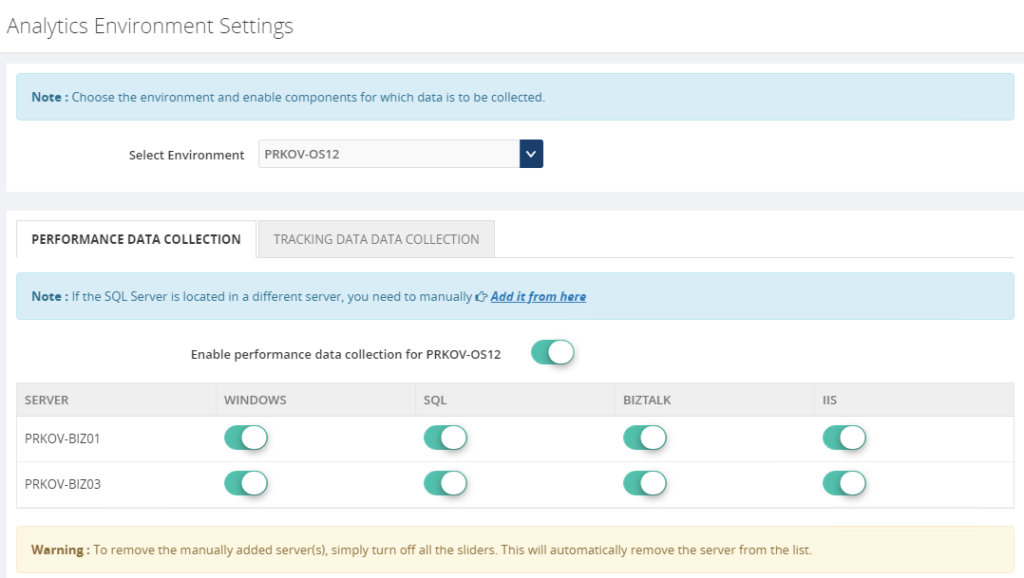
For collecting the performance value of configured environments just enable performance data collection for each server by selecting the respective server name from the dropdown as below .
Once the Analytical service starts collecting the performance data and pushing it to Agent coordinator , the same you can monitor in AppDynamics dashboard for both the environments.
BizTalk360’s monitoring services and user interface can be installed in more than one places which makes the BizTalk360 as Highly available. It’s predominant to monitor the BizTalk Server and maximize the up-time of BizTalk360. By default, the BizTalk360 high availability services will be available as active and passive on the installed servers and make sure the BizTalk360 is healthy(always up).
To make AppDynamics data collection as highly available you have to install the AppDynamics .NET Agent on the machines where BizTalk360 Analytics services are installed. So when ever the analytics service changes its availability (active/passive) it will collect the data and push to AppDynamics.
With its latest release v8.9.6, we will be bringing the capability to push the BizTalk Server analytical performance data to AppDynamics for optimizing and monitoring BizTalk Server. If you have any feedback or suggestion, please write to us at support@biztalk360.com. You can get started to use AppDynamics integration by downloading the 30-day free trial of BizTalk360.