In a data-driven business setup, there will be scenarios where critical executive decisions are made based on the performance reports of various components of the listed servers in their environment. BizTalk360 aims to offer an out of the box tool with similar capabilities as the Performance Monitor tool in Windows servers.
BizTalk360 Analytics offers visual display of the most important performance counters that are consolidated and arranged on a single screen, so that the information can be monitored in a glance. Custom reports can be built in minutes with the metrics that really count for your business, and they’re easy to share with other users in the system. In addition, dashboards can give you a summary of many reports on a single page, using drag-and-drop widgets for fast, easy customization.
The Analytics feature is available only to the Platinum licensed BizTalk360 environments. By default, the Analytics service is installed with BizTalk360 and in non-Platinum environments, users can only view sample analytics data.
It is with the Dashboard widgets that all the performance related information can be seen in a nice graphical display. In the Analytics section, there is also the reporting capability added, where the reports can be sent as attachment in emails.
In this blog I am going to explain a few scenarios where the Analytics widgets are more helpful. Let’s move on.
The Analytics Dashboard contains lot of widgets that provide you detailed information of the performance of your BizTalk environment.
For example, the BizTalk Host Performance widget will help you to get the information of the top performing hosts in the BizTalk environment. The BizTalk messaging performance gives you the picture of the message count and average execution time of the total messages transferred during the configured datetime range.
Date Range – Select the date range for chart. The options are Last 24 hrs, Last 7 days, Last 30 days and Custom:
Based on the selected date range, the performance data gets collected from the BizTalk servers.
The other basic widgets include the Message volume and the Transmission failure rate widgets.
Don’t just stop with the basic widgets in the Analytics section; there is lot more to do with the Custom widgets.
Once the Analytics components, for which the data needs to be collected, are enabled, the different artifacts for the Custom widgets will get enabled. With the Custom widgets you can chose different metrics for which you want to view the data.
Let’s take a few scenarios to understand what we can achieve with the Custom widgets.
There is a scenario where you would like to compare the performance of two BizTalk servers and see which one consumes more memory and CPU. This can be done by selecting the servers in the artifact section and corresponding metrics.
Of course, the count of messages passing through the port can be determined through process monitoring. But it will be checked with specific time intervals either in hours or minutes. But, what if you want to see the count instantly within the specific datetime range. Here comes the Custom widget, with which you can get the count of specific ports.
But to get these data, Tracking needs to be enabled for the ports. Based on the enabled tracking data collection counters, the data gets collected by the BizTalk360 Analytics service using the performance counters.
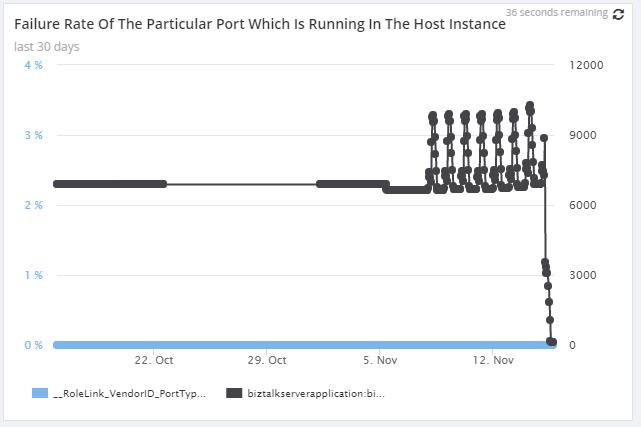
Also, the failure rate of a particular port, running a specific host instance, can be determined with the help of a Custom widget. This would include the failure rate for the port and the number of instances running for that particular host. With the combination of these two metrics, the failure rate of a port can be determined and displayed in a nice graphical view.

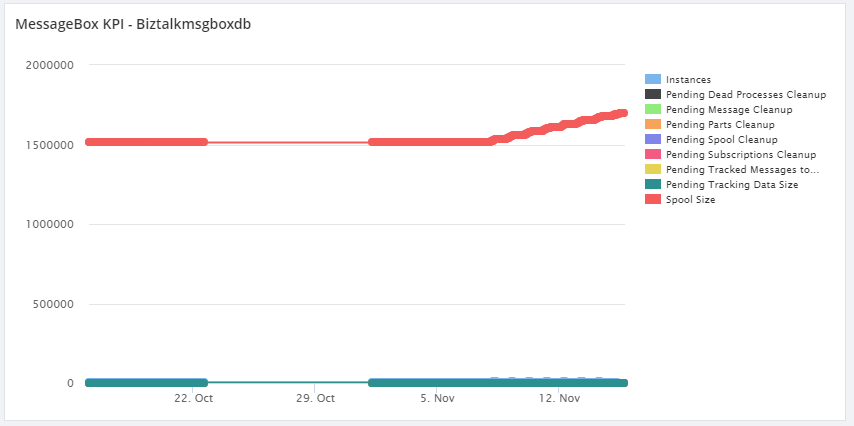
There are also counters for checking the MessageBoxDB. The key performance indicators of the message box database which includes the spool size and the status of the pending jobs, can be visualised with the widgets.

We do have certain metrics like Host Queue Length, number of instances and suspended instances for the particular hosts, which can be obtained from the custom widgets.
Above mentioned are the very few scenarios that can be achieved using the widgets. With the different combinations of the metrics, all performance related information can be obtained through the Analytics widgets.
Do you wish to see more information on the widgets or from the product itself, please put in your suggestions and feedback in our user voice portal https://feedback.biztalk360.com/. The existing ideas can also be voted for. We at BizTalk360 aim at providing the features that fulfill the customer requirements. It is from this feedback portal that the features get picked up for every release.
For more information about how these widgets work, check our Documentation portal.
Happy monitoring with BizTalk360 😊