Your day to day monitoring reports may cover different aspects of performance like BizTalk Servers performance, Suspended/Running Instances, CPU performance, etc. How can all these reports, each with valuable data, be employed for the best performance? The critical information that you expect isn’t always there the way you want it, or there’s too much information for non-BizTalk users to really understand what’s going on.
BizTalk360 enables you to create and switch between multiple dashboards and widgets of your choice, enabling you to visualize the BizTalk performance information in the way you want it. Don’t starve your brain for inputs; instead get the key factors within your Analytics Dashboard.
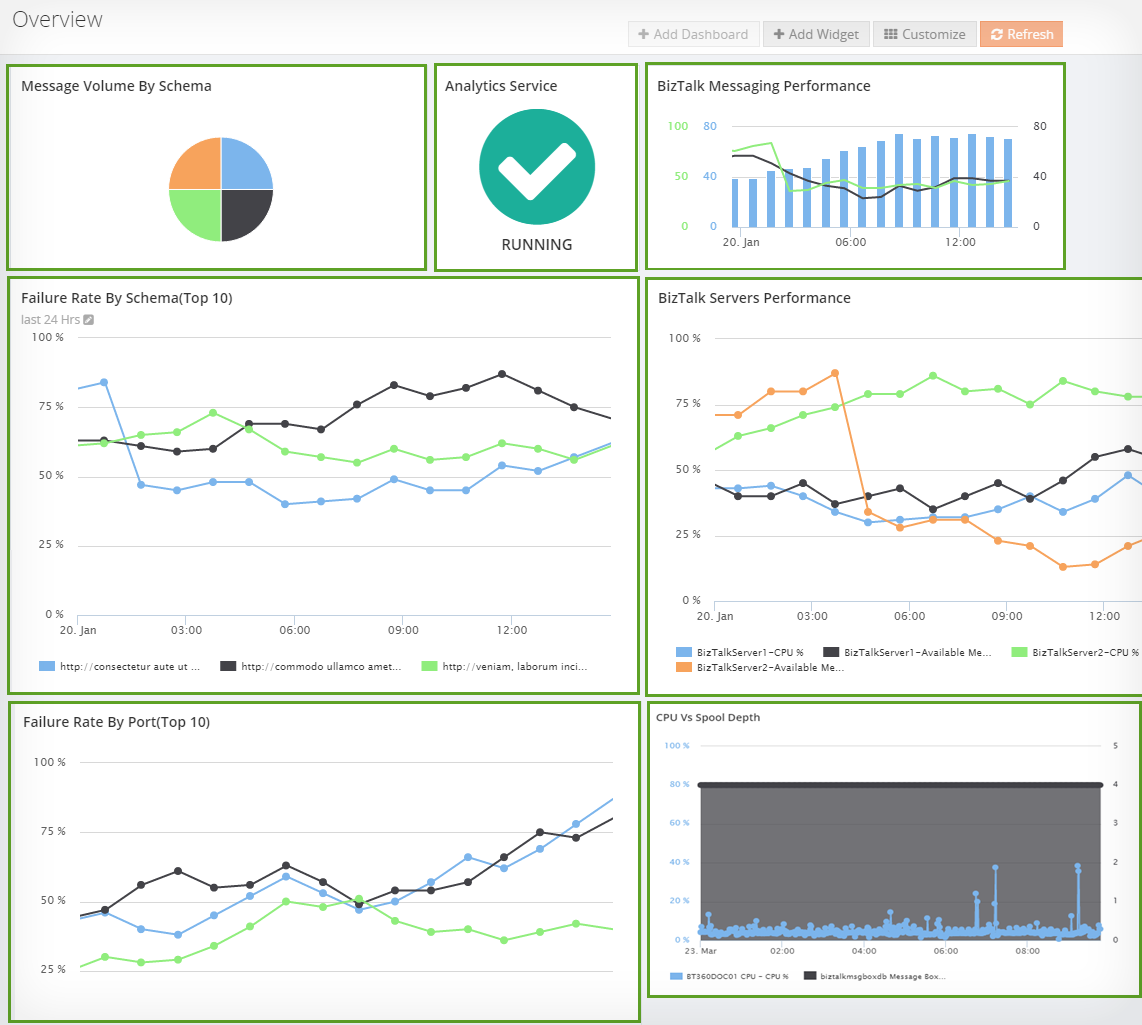
Powerful Dashboards
The Analytics Dashboard is ideally suited for anyone who manages many environments and doesn’t have time to track each one individually. Analytics dashboards provides a simple view of data about performance of your system through live widgets. Typically, analytics widgets provide a snapshot of your performance indicators. Alternatively, create your own custom widgets directly on the dashboard; create multiple dashboards and share them across different teams as a global dashboard.
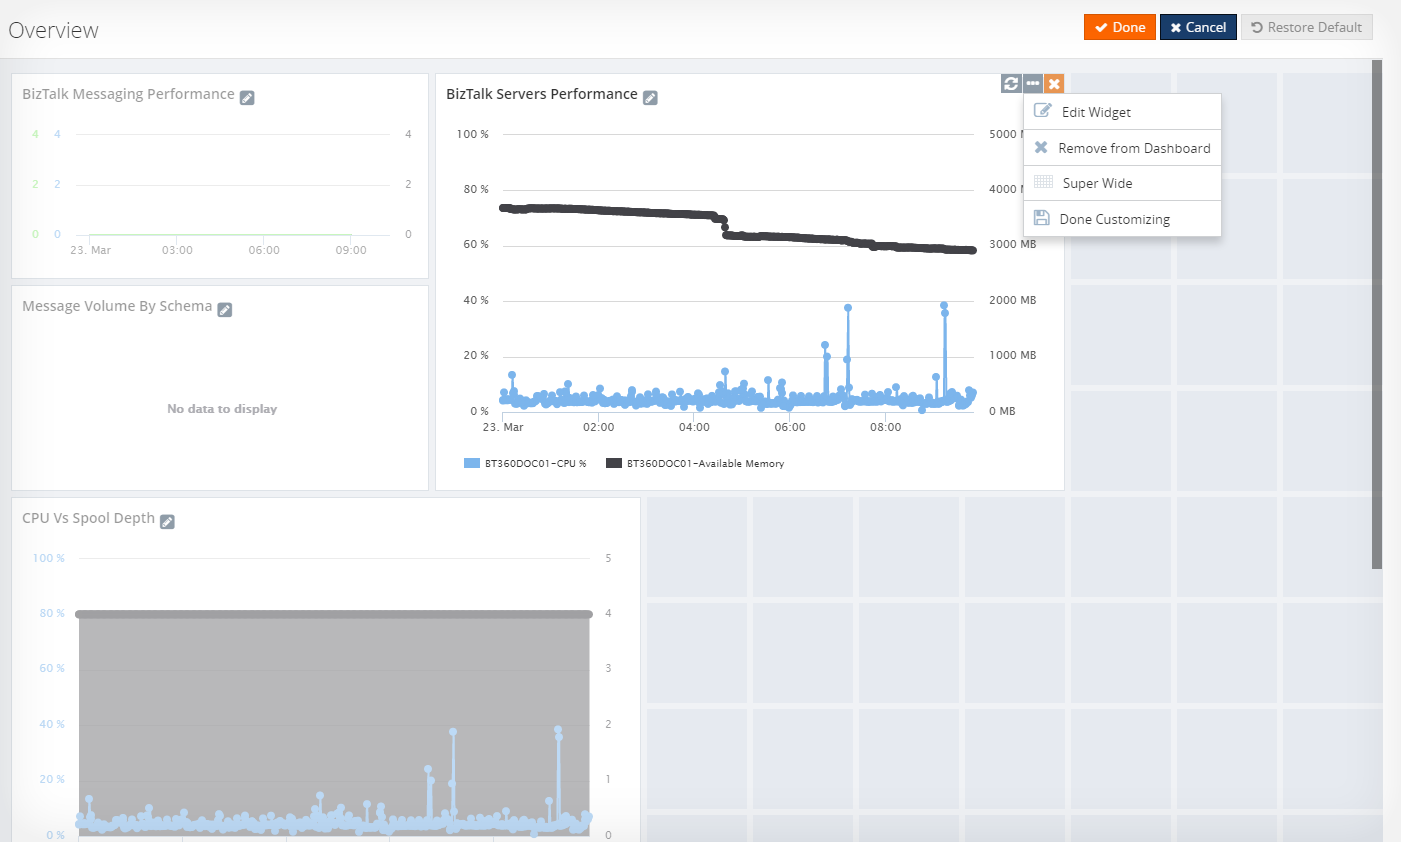
Interacting with Widgets on the dashboard
Easily move/resize the widgets at your convenience through the customization options that are available. You can adjust the refresh rate so your widget always has the latest data. Want to change the name of a widget? We’ve got the option for that too!
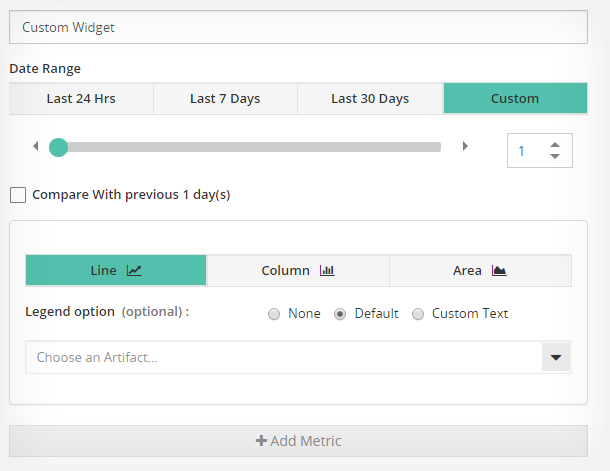
Custom Widgets
It just does not end with the predefined widgets. Creating new widgets is also an easy task with BizTalk360. Most of the time, BizTalk360 will have what you need but, if you want to do something that can’t be done with out of the box widgets, then create a custom widget with different metrics to suit your needs.